Fig. 1.

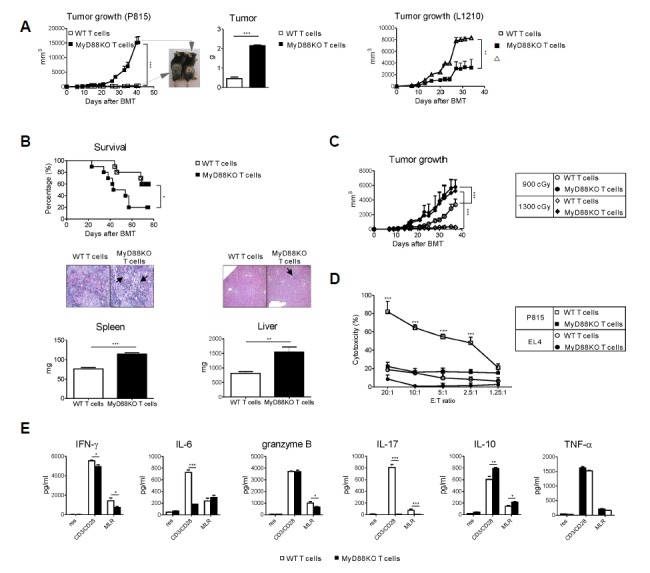
Deficiency of MyD88 in donor T cells mitigates GVL effect. Lethally irradiated recipient mice were transplanted with WT TCD-BM (5 × 10⁶) together with either WT or MyD88KO mice spleen T cells (1 × 10⁶) on day 0. (A) Recipient mice were injected s.c with 1 × 10⁶ P815 cells (left) or L1210 cells (right) on day 1 post-transplantation. Tumor growth was monitored every 3 or 4 days after s.c tumor inoculation. Tumor measurement was finally determined on day 42. Mice were sacrificed and tumor weights were measured (***P < 0.001). Data are presented as mean ± SEMs and are representative of duplicate experiment (n = 12 per groups). (B) Lethally irradiated recipient mice were transplanted with WT TCD-BM (5 × 10⁶) together with either WT or MyD88KO mice spleen T cells (1 × 10⁶) on day 0. Thereafter recipient mice were injected i.v with 3 × 10³ P815 tumor cells on day 1. Kaplan-Meier survival curve of the transplanted mice (top, n = 10 per group). Percent survival after transplantation, WT T cells vs. MyD88KO T cells by the wilcoxon rank-sum test (*P < 0.05). Mice were sacrificed and spleen and liver weights were measured on day 48 (bottom, n = 5 per group; **P < 0.01 or ***P < 0.001). Arrows indicate the aggregation of leukemic cells. Data are presented as means ± SEMs and representative of duplicate experiment (n = 10 per groups). (C) Recipient mice were irradiated with 900 (○ and ●, n = 6) or 1300 cGy (◇ and ◆, n = 6) TBI and injected with 5 × 10⁶ TCD BM together with either WT or MyD88KO mice spleen T cells (1 × 10⁶) on day 0. All animals were also injected s.c. with 1 × 10⁶ P815 tumor cells on day 1 and tumor growth was monitored (***P < 0.001). Data from one of two replicate experiments that yielded similar results are shown. Data are presented as means ± SEMs. (D, F) B6 WT or MyD88KO CD3+ T cells were co-cultured with F1 stimulators in a primary mixed lymphocyte reaction (MLR). (D) After 4 days of MLR, purified CD8+ cells were assessed for cytotoxicity against P815 (H-2d, □ and ■, n = 4) or EL4 (H-2b, ○ and ●, n = 4) target cells. (F) Culture supernatants from MLR were collected and assayed for IFN-γ, IL-6, granzyme B, IL-17, IL-10 and TNF-α production. Data shown (D, F) are representative of two independent experiments. Data are presented as means ± SEMs. *P < 0.05, **P < 0.01 or ***P < 0.001.
