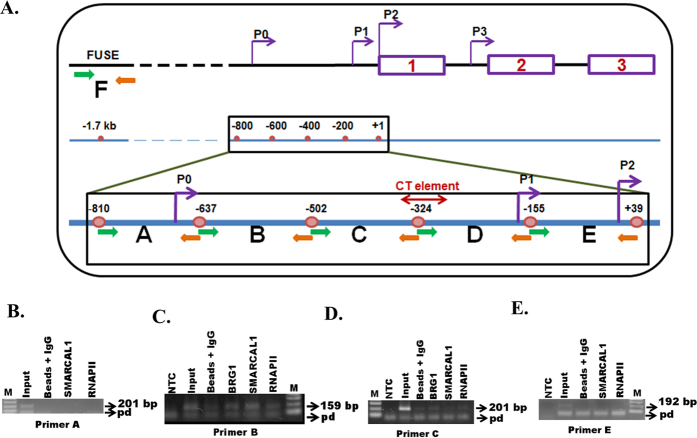
Figure 1. Analysis of occupancy of BRG1, SMARCAL1, and RNAPII on c-myc promoter.
(A). Schematic representation of c-myc promoter showing promoters, P0, P1, P2, and P3 along with the CT element and FUSE region. The ChIP primers designed for analyzing the occupancy of BRG1, SMARCAL1 and RNAPII are also indicated in the figure. (B). Occupancy of SMARCAL1 and RNAPII at primer A region. (C). at primer B region, (D). at primer C region, and (E). at primer E region. The PCR products were resolved on 1% agarose gel. The primer-dimer formation is indicated by pd.

