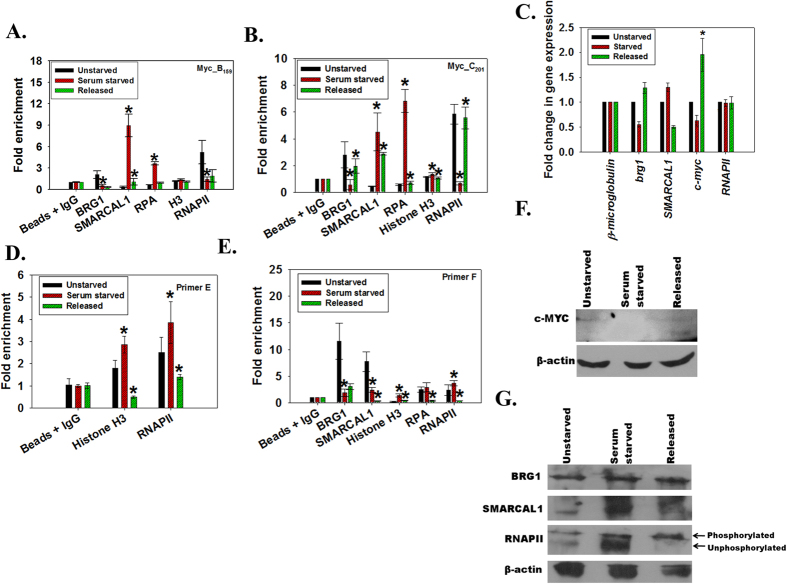
Figure 2. Analysis of occupancy of BRG1, SMARCAL1 and RNAPII on c-myc promoter during and after serum starvation.
(A). Occupancy of BRG1, SMARCAL1, RPA, histone H3, and RNAPII was analyzed on Myc_B159 region using quantitative real-time RT-PCR following ChIP using respective antibodies. The star indicates statistical significance at p < 0.05. (B). Occupancy of BRG1, SMARCAL1, RPA, histone H3, and RNAPII on Myc_C201 region of c-myc promoter was analyzed using quantitative real-time RT-PCR following ChIP using respective antibodies. The star indicates statistical significance at p < 0.05. (C). Expression of c-myc, SMARCAL1, brg1, and RNAPII was monitored using quantitative real-time RT-PCR. β- microglobulin was used as control in this experiment. The star indicates statistical significance at p < 0.05. (D). Occupancy of histone H3 and RPA on Primer E region was analyzed using quantitative real-time RT-PCR following ChIP with respective antibodies. The star indicates statistical significance at p < 0.05. (E). Occupancy of BRG1, SMARCAL1, histone H3, RPA and RNAPII on FUSE region was analyzed using quantitative real-time RT-PCR following ChIP with respective antibodies. The star indicates statistical significance at p < 0.05. (F). c-Myc expression in unstarved, serum starved, and cells released from the block was analyzed using western blot. (G). SMARCAL1, BRG1, and RNAPII expression in unstarved, serum starved, and cells released from serum starvation were analyzed using western blots. In this experiment, β-actin was used as the control. Quantitation of pixel values is provided in Supplementary Fig. S2. Uncropped western blots are provided in Supplementary Fig. S11.

