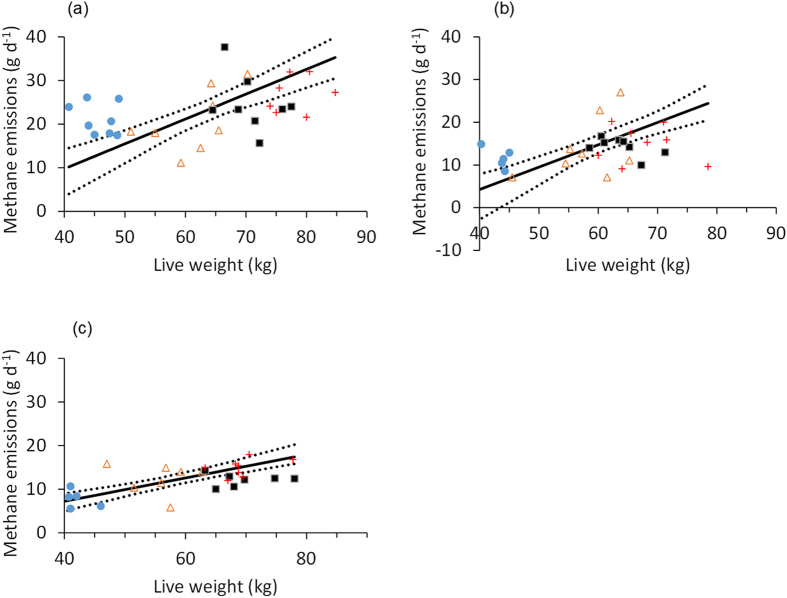
Figure 2.
Relationships between ewe live weight and methane emissions when offered (a) ryegrass, (b) permanent pasture, and (c) Molinia. The solid lines are the linear functional relationships, and the dotted lines are the 95% confidence intervals. Four breeds were used: Welsh Mountain ( ), Scottish Blackface (
 ), Welsh Mule (■) and Texel (
 ).
).

