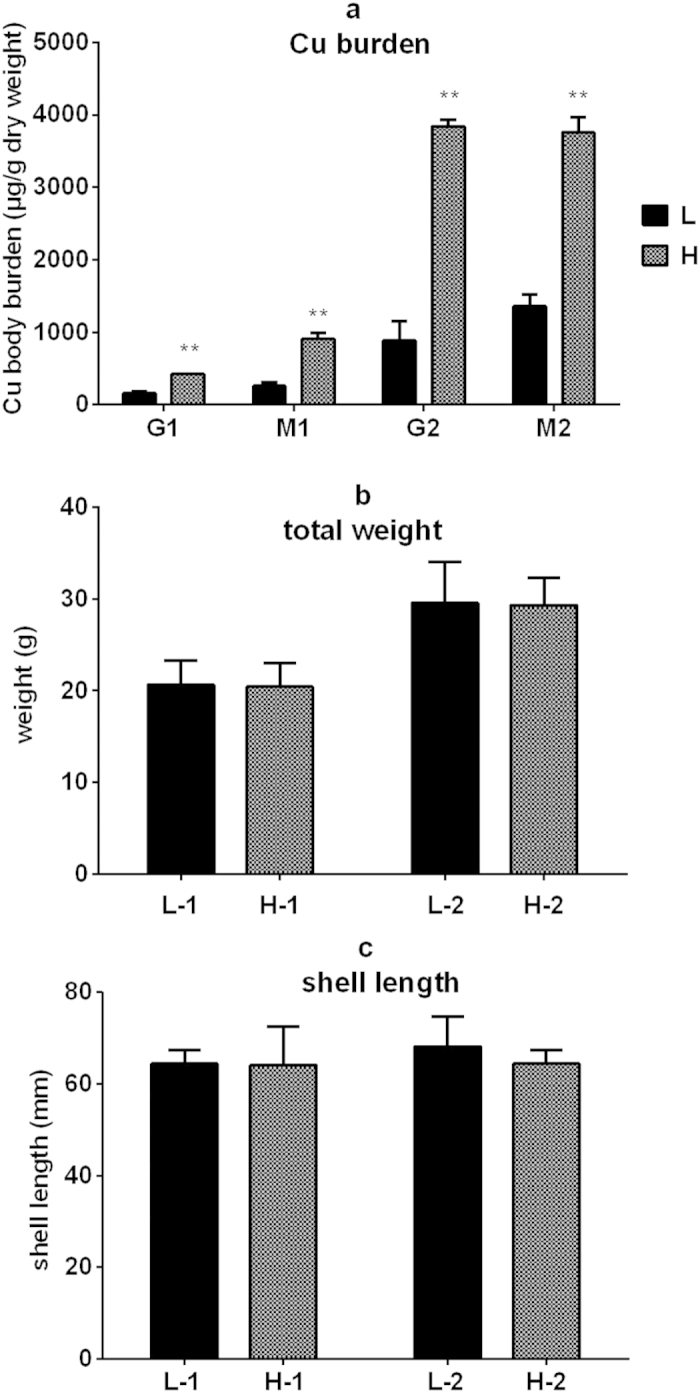
Figure 1.

The tissue Cu concentration (a), total body weight (b) and shell length (c) of oysters selected for DGE. G1 and M1: gills and mantle tissues without experimental Cu exposure; G2 and M2: gills and mantle tissues after Cu exposure; L and H represent low and high Cu tissue concentration, respectively. L-1 and H-1: oysters without experimental Cu exposure; L-2 and H-2 oysters after Cu exposure. Data are mean ± s.d. (six replicates); **p <0.01 (pair-wise t test).
