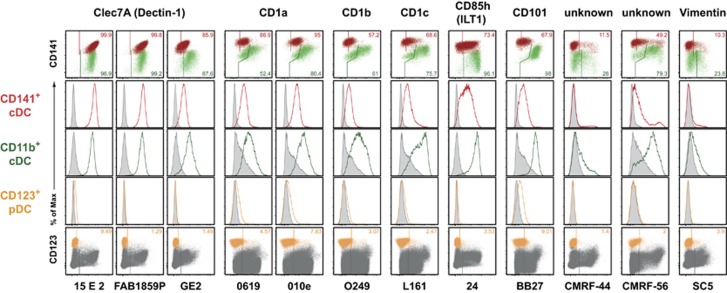
Figure 3.
HLDA10 mAb binding to both thymic cDC subsets but not to pDC. HLDA10 mAb reacting with cDC but not pDC. Dot plots show stainings as overlays of CD141+ (red) versus CD11b+ (green) cDC (top row), or pDC (orange) within total thymocytes (dark gray) (bottom row). Inset numbers give the proportion of the respective DC populations stained. Gates were set according to background controls (FMO for fluorophore-labeled mAb, secondary reagent controls for IgM or biotinylated mAb or isotype controls for unlabeled IgG mAb). Histogram overlays (middle rows) show signals of the panel mAb obtained with the color-coded thymic DC populations (open histograms) in comparison with the background staining (filled-in gray). The minimal signals with mAb to CD1a, CD1b, CD1c and CD101 on pDC were regarded as background. The reactivity with other thymic cell populations can be seen in Table 1. Shown are representative data from one out of three thymic tissues.

