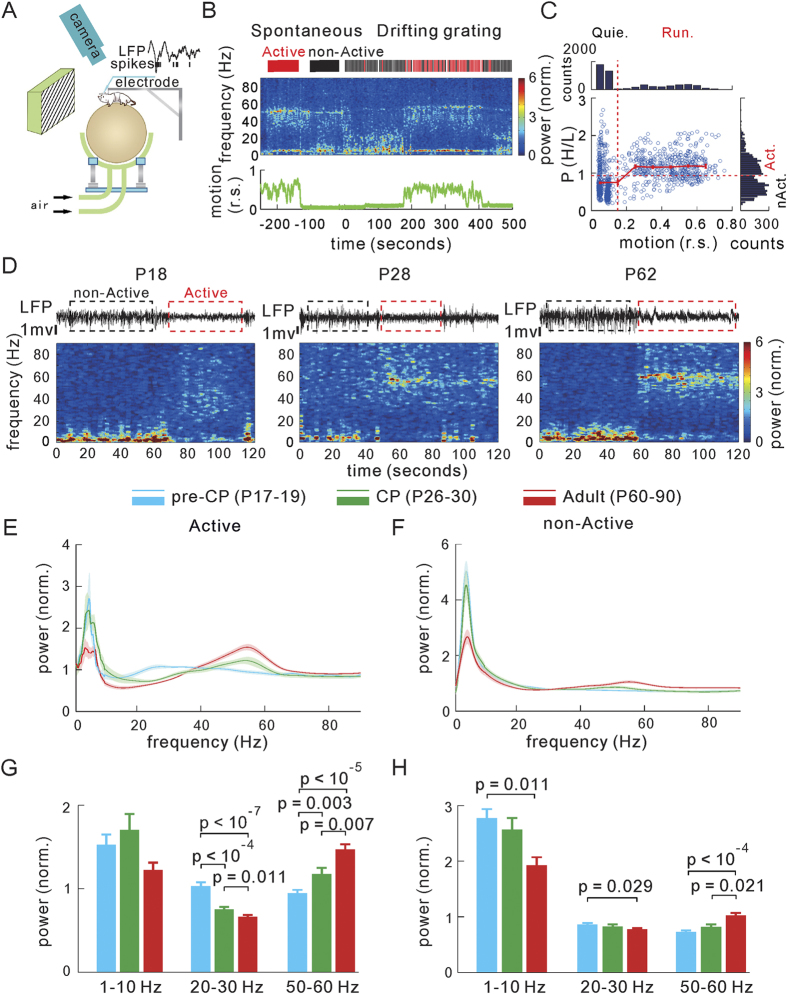
Figure 1. Developmental changes of spontaneous LFP’s power spectrum.
(A) A diagram showing the experimental setups with visual stimulation, behavior monitoring and electrophysiological recording in the head-fixed awake mouse. The animal could stand still or run on a Styrofoam ball suspended on air. (B) Time-frequency power spectral analysis of the LFP recorded during the periods without (spontaneous) and with visual stimuli (drifting grating, top). The relative speed (r.s., arbitrary unit) of the animal was calculated from video scenes (25 frames/s, the relative speed of motion was frame-to-frame pixels’ luminance changes at 5 frames/s with a down sampling, bottom, details see Supplementary Fig. 1). The durations or stimulation trials of Active (Act.) and non-Active (nAct.) states are indicated by the red and black bars, respectively (top). (C) Correlation plot of the power ratio of high (H: 40–70 Hz) and low (L: 1–20 Hz) frequency bands, P(H/L), to the animal motion (r.s.). Each point represents the mean values of 1-s windows from the continuous recording shown in (B). Solid red line: averaged values of P(H/L) calculated with a bin width of 0.1 r.s. Dash red line: vertical line indicates the r.s. value (0.15) to classify Quiescent (Quie.) and Running (Run.) states, horizontal line indicates the mean P(H/L) of all data points. Inserts: histogram distributions of the P(H/L) (right) and the relative speed (top), respectively. (D) Example spontaneous LFPs (top) and their power spectrogram in the non-Active (black box) and Active (red box) states in the mice at P18 (pre-CP), P28 (CP) and P62 (adult). (E,F) Averaged power spectrum of all examined mice at three stages (pre-CP: P17–19, n = 16 mice; CP: P26–30, n = 13; adult: P60–90, n = 13) in the Active (E) and non-Active (F) states. Shadow areas indicate the mouse-to-mouse s.e.m. (G,H) Changes of power of delta/theta (1–10 Hz), beta (20–30 Hz) and gamma (50–60 Hz) band activities in the Active (G) and non-Active (H) states among the three stages. Error bars represent mouse-to-mouse s.e.m. The p values were calculated by the unpaired Kolmogorov–Smirnov test.

