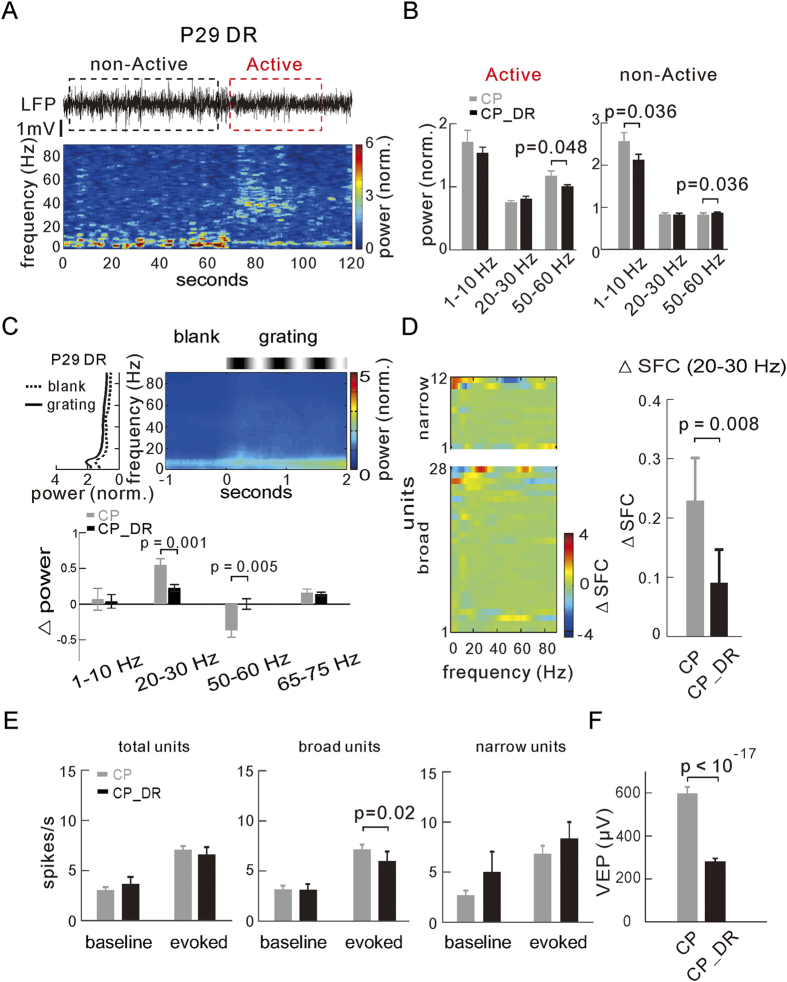
Figure 6. Effects of dark rearing on the maturation of neural oscillations.
(A) Example spontaneous LFPs (top) and their power spectrogram in the non-active (black box) and active (red box) states in the dark reared mice at P29 (CP_DR). (B) Comparison of average power of spontaneous activities at the delta/theta (1–10 Hz), beta (20–30 Hz) and gamma (50–60 Hz) bands during the active (left) and non-active (right) states between the dark-reared (n = 13 mice) and normal-reared mice at the CP (P26–30). (C) Top, the power spectrogram (right) and the corresponding plot of the averaged power (over the time) along the frequencies (left) during the blank and visual stimulation periods in dark-reared mice (scale bar is the same as the normal-reared mice for comparison). Bottom, difference of the ∆power at discrete frequency bands between the dark-reared (n = 12 mice) and normal-reared mice (states pooled). (D) Visually induced ∆SFC for the broad- and narrow-spiking units (left) and the average ∆SFC at the beta band (20–30 Hz) for all units recorded in dark-reared mice (n = 40 units in 12 mice, right, states pooled). (E) The baseline and evoked spike rates of all units (left), broad- (middle, n = 39) and narrow- (right, n = 15) spiking units recorded in dark-reared and normal-reared mice. (F) Comparison of VEP amplitudes between the dark-reared (n = 169 recording sites in 12 mice) and normal-reared mice at CP. Error bars represent s.e.m. The significance (p values) of difference between data groups is tested by the unpaired Kolmogorov–Smirnov test.

