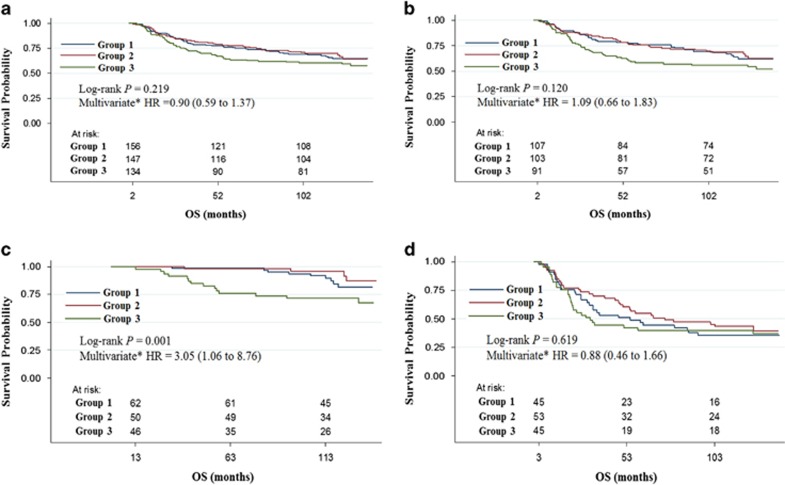
Figure 2.
Correlation between the CPCC and OS. Kaplan–Meier plots of the CPCCs for the (a) total, (b) male, (c) T1 or T2 male and (d) T3 or T4 male gastric cancer cases are shown. The P-values were determined through a log-rank test. The HRs and 95% CIs of the CPCC group 3 (highest tertile, CPCC⩾18) are compared with the CPCC group 1 (lowest tertile, CPCC⩽6) through multivariate analyses, as shown. The numbers at risk are also shown. CPCC, chromatin CKAP2-positive cell count; x axis, OS in months; y axis, survival probability.

