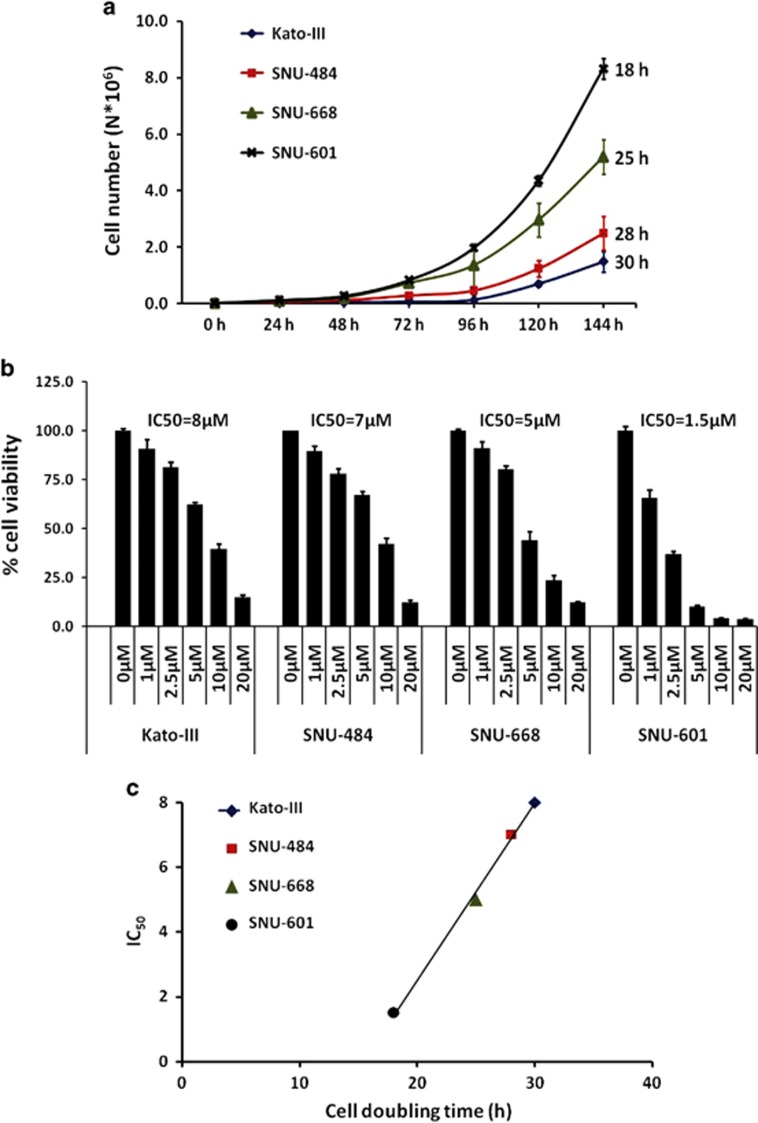
Figure 3.
Correlation between cell doubling time and sensitivity to cisplatin in male gastric cancer cells. (a) Cell growth as measured by counting cell number (mean±s.e.m., N=3) at the indicated time points for the following male gastric cancer cell lines: Kato III, SNU-484, SNU 601, and SNU-668. The cell doubling time (calculated by the exponential regression method) for each cell is indicated at the end of the graph line. (b) Sensitivity to cisplatin, as measured by crystal violet after the treatment with various concentrations of cisplatin, is indicated on the x axis for 72 h. On the y axis, the percentage of viable cells (mean±s.e.m., N=5) after calculating the ratios between the treated and the control cells is shown. The IC50 is shown for each cell line. (c) Positive correlation between shorter cell doubling time and higher sensitivity to cisplatin (R=0.999, P=0.083). On the x axis is the cell doubling time; on the y axis, the IC50.

