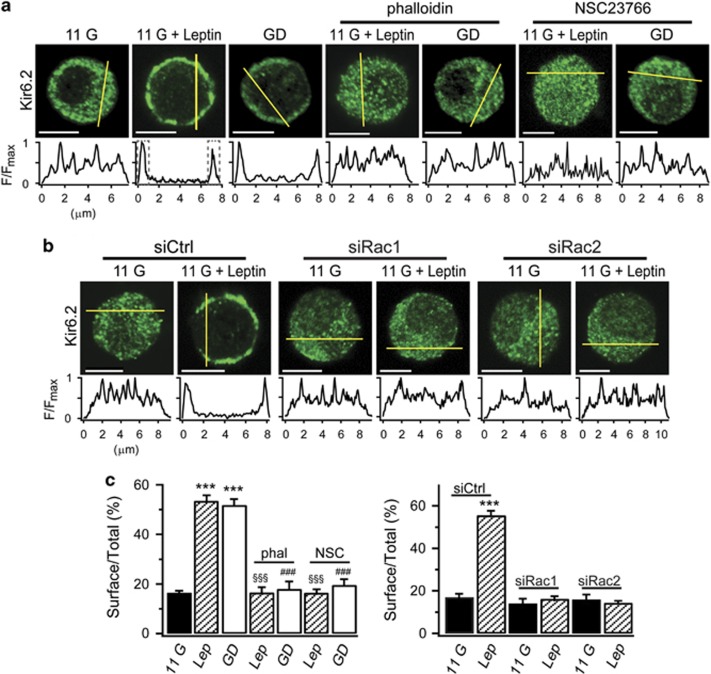
Figure 3.
AMPK-induced KATP channel trafficking is inhibited by Rac inhibition. (a) Immunofluorescence analysis of the subcellular localization of KATP channels in INS-1 cells using anti-Kir6.2 antibody in the presence of 11 mM glucose (11 G), 10 nM leptin in 11 G (11 G+Leptin), 0 mM glucose (GD), leptin and 10 μM phalloidin (phal) or 50 μM NSC23766 (NSC) in 11 G, and 10 μM phalloidin or 50 μM NSC23766 in GD. The yellow line across the cell used to measure Kir6.2 fluorescence intensity is shown underneath each image. Scale bar, 5 μm. (b) Experiments and analyses were the same as in (a), with the exception that the comparison was carried out in the absence or presence of leptin in siCtrl-, siRac1-, or siRac2-transfected cells. Scale bar, 5 μm. (c) Integration of the fluorescent intensities at the cell periphery (1 μm each, dashed line boxes) reflects the surface density of Kir6.2. Surface localization of Kir6.2 was expressed as the ratio of surface to total Kir6.2 fluorescence. Data are represented as the mean±s.e.m. (n=5-24). ***P<0.001 compared with 11 G. §§§P<0.001 compared with Leptin (Lep). ###P<0.001 compared with GD.

