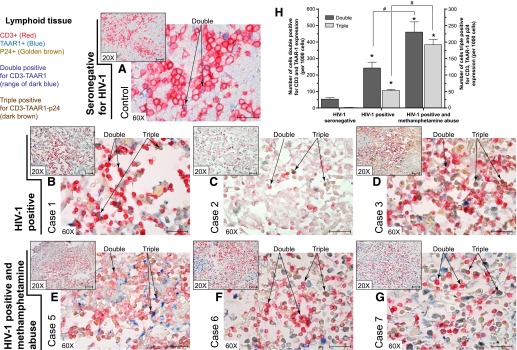
Figure 6. TAAR1 expression in lymph nodes of HIV-1-infected patients, with or without a history of METH abuse.
Paraffin-embedded lymph node tissue was sectioned at 5 μm and immunostained for CD3, TAAR1, and the HIV-1 core protein p24. As shown in the multiplexed images, the T lymphocyte marker CD3 appears in red (Vector Red), TAAR1 expression is observed in blue (Vector Blue), and p24 appears as golden brown (ImmPACT DAB). Representative images of (A) HIV-1 seronegative control, (B–D) HIV-1-positive cases (n = 3) with no history of METH abuse, and (E–G) HIV-1-positive individuals with a known history of METH abuse. Small insert images were taken under 20× objective magnification (original scale bars, 50 μm); the larger images were taken under 60× objective magnification (original scale bars, 25 μm). (H) Graph showing image analysis (with the use of segmentation, color threshold, and particle counting) results of the number of cells showing double (plotted on the left y-axis) and triple (plotted on the right y-axis) labeling. Results are shown as the averages ± sem. Statistical analyses were performed by use of one-way ANOVA with Dunnett’s multiple comparisons. Statistical significance differences, *P < 0.05, comparisons with the control (seronegative for HIV-1); #P < 0.05, analysis of those particular group comparisons.

