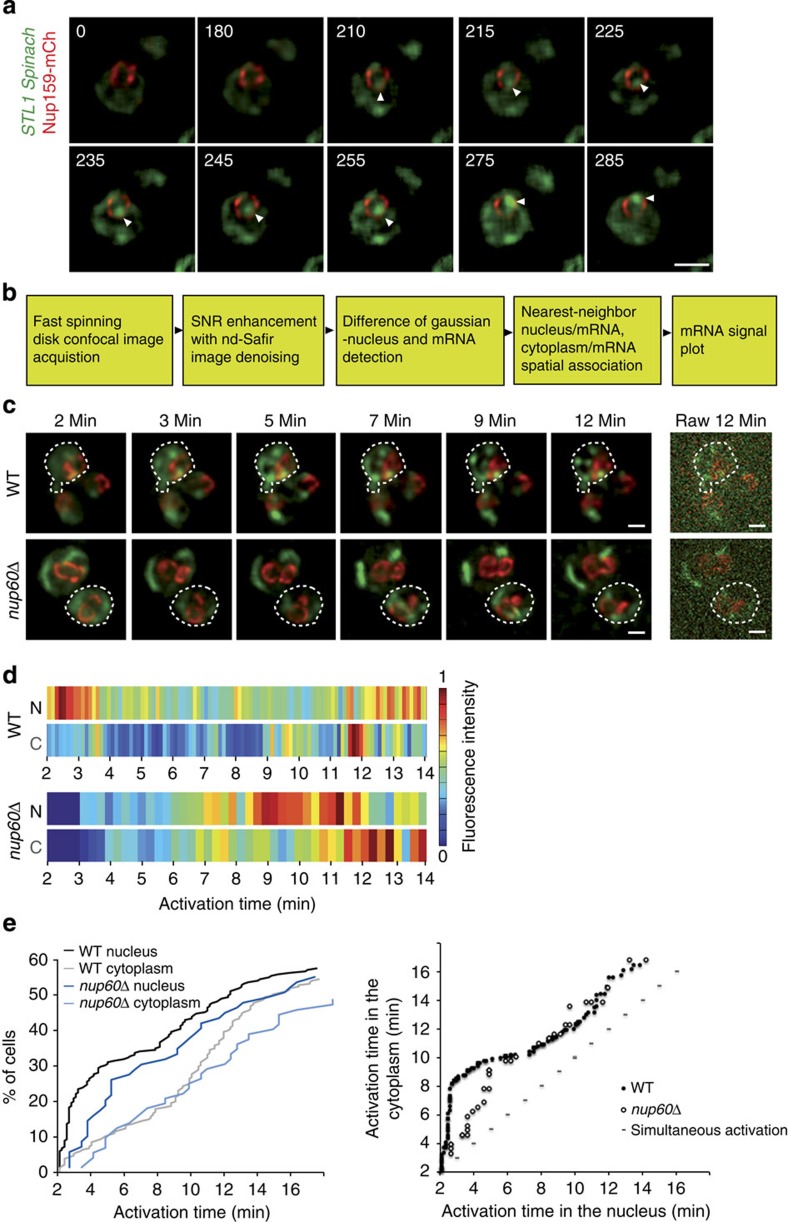
Figure 2. Precise spatiotemporal analysis of STL1 Spinach expression.
(a) Fast time-lapse movie of STL1 activation. STL1 Spinach signal induced on treatment with 0.4 M NaCl was registered 2 min after the induction, to avoid side effects of cell shrinkage. Images were acquired by spinning-disk microscopy on a single plane with one frame per second for 5 min. Nuclear transcripts appeared as a nuclear dot indicated by a white arrow. The nuclear periphery was visualized with Nup159–mCherry. Scale bar, 2 μm. See Supplementary Movie 1. (b) Worflow scheme developed to image, detect and analyse Spinach-tagged RNA in live yeast. (c) Induction of STL1 transcript in wt and nup60Δ living cells. STL1 Spinach signal induced as in a was recorded 2 min after induction with one Z stack of 11 frames per 5 s for wt and one Z-stack of 14 frames per 20 s for nup60Δ cells during 12 min. Images correspond to maximum projections of denoised spinning-disk Z-stack images (11 and 6 frames for wt and nup60Δ) at precise time points. Unprocessed Z-stack projections corresponding to the last time point are shown on the right (raw). Scale bar, 1 μm; see Supplementary Movies 2 and 3. (d) Heat maps. Changes of fluorescence intensity of STL1-Spinach dots from cells shown in c were measured in 3D, inside the nucleus (N) and in the cytoplasm (C). The colour bar indicates fluorescence intensity, with dark blue for the absence of fluorescence and red indicating maximum fluorescence presence. (e) Kinetics of STL1 activation. The time of first appearance of STL1 transcripts, in the nucleus (black and dark blue for wt and nup60Δcells) and in the cytoplasm (grey and light blue for wt and nup60Δ cells), was defined for each single cell from the heat maps (n=235 wt cells; n=72 nup60Δ cells). The cumulative distribution, corresponding to the % of activated cells that display the first detection of a Spinach signal at a given time point was plotted as a function of activation time (left panel). The first occurrence of the Spinach signal in the cytoplasm was also plotted as a function of the first occurrence of the nuclear signal in each single cell (right panel). Each dot corresponds to a single cell. The theoretical line corresponding to a simultaneous appearance of the signal in the nucleus and cytoplasm is represented by the dashed line.

