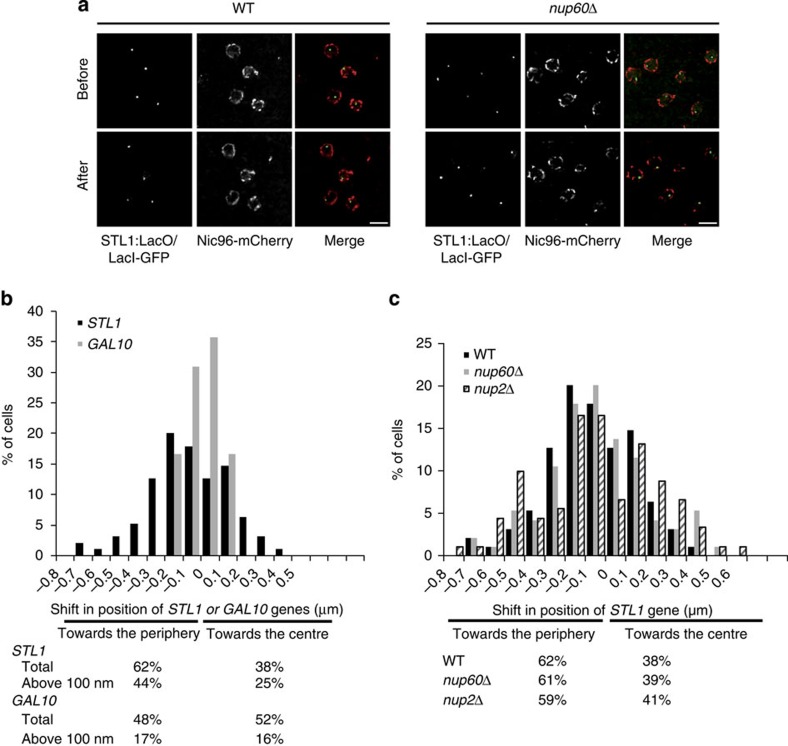
Figure 4. Localization of STL1 gene locus in live yeast.
(a) Imaging STL1 gene positioning on activation. Cells were imaged for Nic96–mCherry and GFP–LacI before and after 10 min activation with NaCl 0.4 M and analysed using the imaging workflow validated in Fig. 3. Scale bar, 2 μm. (b) STL1 and GAL10 gene positioning on activation in wt cells. The shift in position of the gene was calculated in 3D on n=95 cells for STL1 and n=42 for GAL10 recorded as in a. A negative shift corresponds to the gene moving close to the nuclear periphery, whereas a positive shift describes movement towards the centre of the nucleus. Total % of cells presenting a shift of STL1 or GAL10 gene loci or % of cells presenting a shift above 100 nm of STL1 or GAL10 gene loci towards the periphery or the centre is indicated. (c) STL1 gene positioning on NUP60 and NUP2 deletion. The shift in position of the gene was calculated in 3D on n=95 wt cells, n=95 for nup60Δ cells and n=91 for nup2Δ cells recorded as in a. Total % of cells presenting a shift of STL1 gene locus towards the periphery or the centre is indicated for the different strains.

