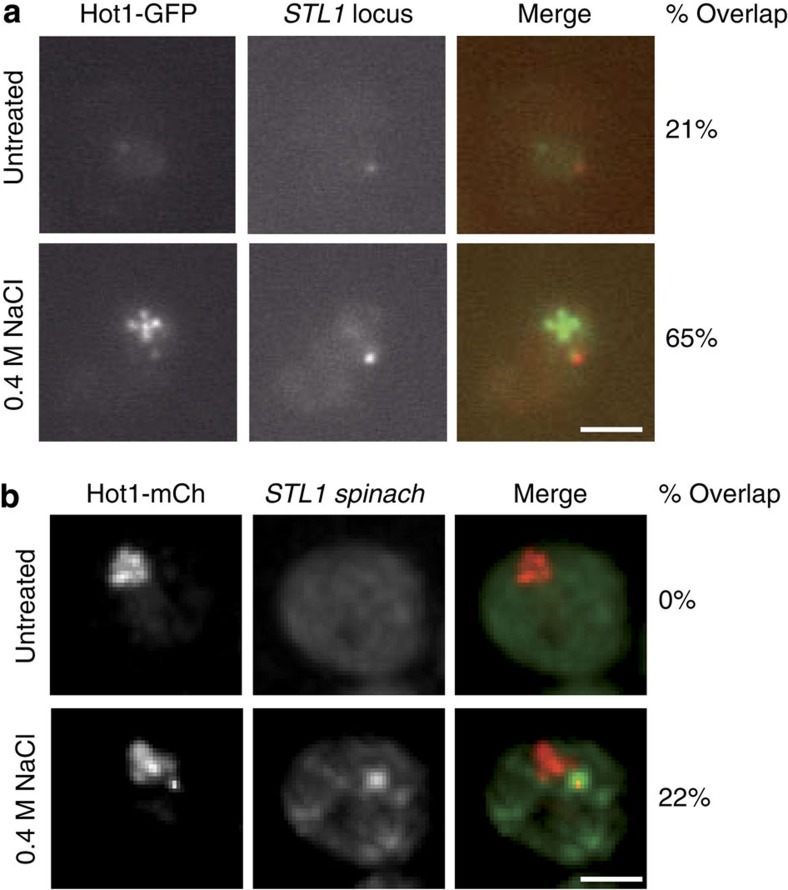
Figure 5. Co-localization of the transcription factor Hot1 with the STL1 gene and transcripts.
(a) Co-localization of the STL1 gene and the osmotic stress-induced transcription factor Hot1. Cells were imaged from untreated (n=52) and 0.4 M NaCl-treated (n=105) cultures for Hot1–GFP and mCherry–LacI. (b) Co-localization of the STL1 transcript and the osmotic stress-induced transcription factor Hot1. Cells expressing Hot1–mCherry and STL1-Spinach in the same field were imaged before and after a 5-min 0.4 M NaCl treatment (n=226). Scale bar, 2 μm.

