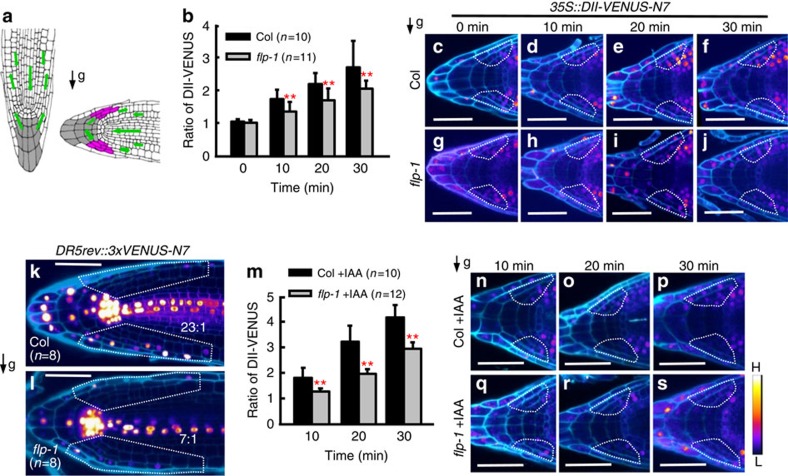
Figure 2. The ratios of DII-VENUS reveal a delayed auxin asymmetry in flp roots.
(a) Schematic diagrams of Arabidopsis root tips before and after a 90° reorientation. Gravity stimulation induces an asymmetric auxin redistribution to the two sides of the root tip. Green arrows indicate auxin flows. Grey filled cells are four tiers of columella cells. Purple coloured cells are LRC cells adjacent to columella cells in which DII-VENUS fluorescence intensities were measured. Black arrow indicates the direction of the gravity vector. (b) Ratios of DII-VENUS signals between LRCs at upper and lower side. Both wild-type and flp-1 mutants show an increasing DII-VENUS asymmetry over time, but flp-1 shows significantly lower ratios than the wild type at each time point. Representative heat map images show differential DII-VENUS fluorescence intensity across the Col (c–f) and flp-1 (g–j) root tips. Asymmetric expression of DR5 across the primary root tips in Col (k) and flp-1 (l) at 4 h after reorientation. Numbers at the lower right side are ratios of DR5 signals in the lower to the upper side (within white frames). (m) Ratios of DII-VENUS after reorientation in auxin pretreated (1 nM, 2 h) Col and flp-1 roots. At 20 min after reorientation, auxin-promoted asymmetric DII-VENUS signals across roots can be found. However, Col still displays a significant higher DII-VENUS ratio than flp-1. (n–s) Representative heat map images showing a reduced overall DII-VENUS signal in auxin pretreated (1 nM, 2 h) root tips, compared with that of untreated roots in c–j, respectively. White frames in c–j, n–s denote the LRCs used for DII-VENUS fluorescence intensity measurements. Cell outlines were visualized after staining with propidium iodide and then presented in a pseudo blue colour. Colour bar at the lower right side indicates fluorescence intensities from low (L) to high (H). Asterisks in b,m indicate significant differences between Col and flp-1 at same time points (Student's two-tailed t-test; **P<0.01; three individual experiments; n, number of roots scored for each time point and genotype). Bars represent mean values with s.d. Scale bars, 50 μm.

