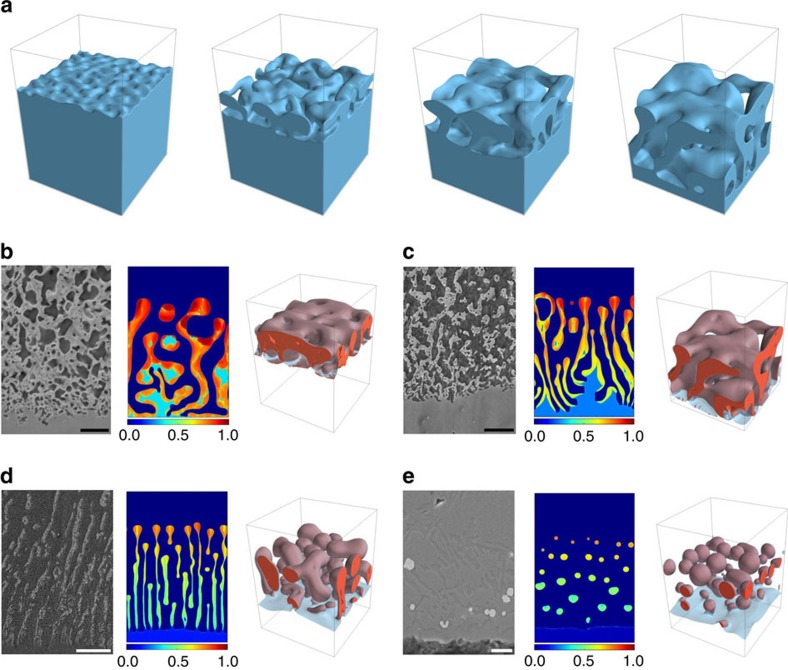
Figure 1. Microstructure and toplogy selection.
(a) Phase-field simulation illustrating the formation of a topologically connected bicontinuous nanostructure during the dealloying of a Ac0B1−c0 alloy in contact with a pure C liquid for c0=25%. Snapshots of the solid–liquid interface (φ=1/2 surface) are shown at dealloying times  . The simulation domain size is 96 × 96 × 128 nm3. Structures for c0=35% (b), c0=25% (c), c0=15% (d) and c0=5% (e) in experiments, and 2D and 3D simulations in domain sizes 256 × 384 nm2 and 96 × 96 × 128 nm3, respectively. 2D simulation results are shown by a colourmap of the concentration of the immiscible alloy element A. For 3D results, the solid–liquid interface is represented in transparent light blue, while the red surface represents an iso-concentration surface cA=1/2, delimiting the A-rich solid phase. The solid–liquid interface appears in light blue at the dealloying front and brown (due to colour addition of light blue and red) when the interface covers the A-rich phase. Scale bars, 1 μm (b), 3 μm (c), 10 μm (d) and 5 μm (e) (on experimental pictures, respectively).

