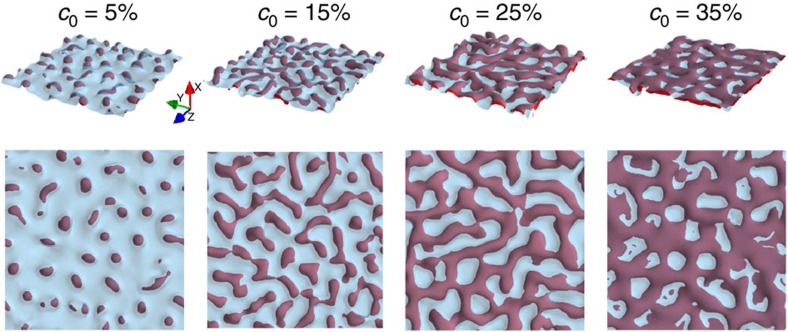
Figure 4. Topology of compositional domains.
Snapshots (96 × 96 nm3) of 3D phase-field simulations highlighting the solid–liquid interface and compositional domains at the early stage of dealloying with the same colour coding as in Fig. 1. Domains become progressively more connected within the interfacial layer with increasing initial alloy composition c0 and seed, the growth of topologically distinct globular, filamentary, and connected structures (Fig. 1b–e).

