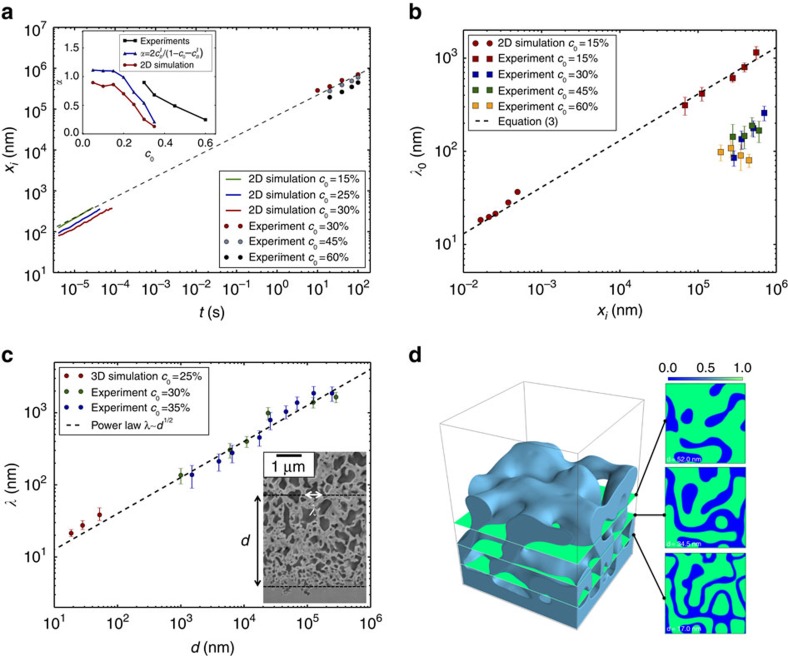
Figure 5. Scaling laws for dealloying kinetics and pattern length scales.
(a) Log–log plot of dealloying depth xi versus time from simulations (lines) and experiments (dots) for different alloy composition. The dashed black line represents a power law with the characteristic 1/2 exponent of diffusion-limited kinetics. (b) Interface pattern scale at the dealloying front λ0 versus dealloyed depth xi showing agreement of simulations and experiments with theory (equation (3) is represented with a dashed line) over four decades of length scales for diffusion-coupled growth of lamellar/filamentary disconnected structures (c0=15%). Topologically complex connected structures for higher c0 exhibit an increase of λ0 with dealloyed depth, but with λ0 smaller than predicted by equation (3) that no longer holds. (c) Log–log plot of λ versus d where λ≥λ0 denotes the structure scale at a distance d from the dealloying front increased by coarsening for connected structures. Simulations and experiments follow the predicted coarsening behaviour with a 1/2 exponent. (d) Simulation snapshot and cross-sections showing the coarsening of the connected structure obtained in 3D simulation for c0=25%. Error bars on the experimental data points represent the s.d. obtained from 20 measurements.

