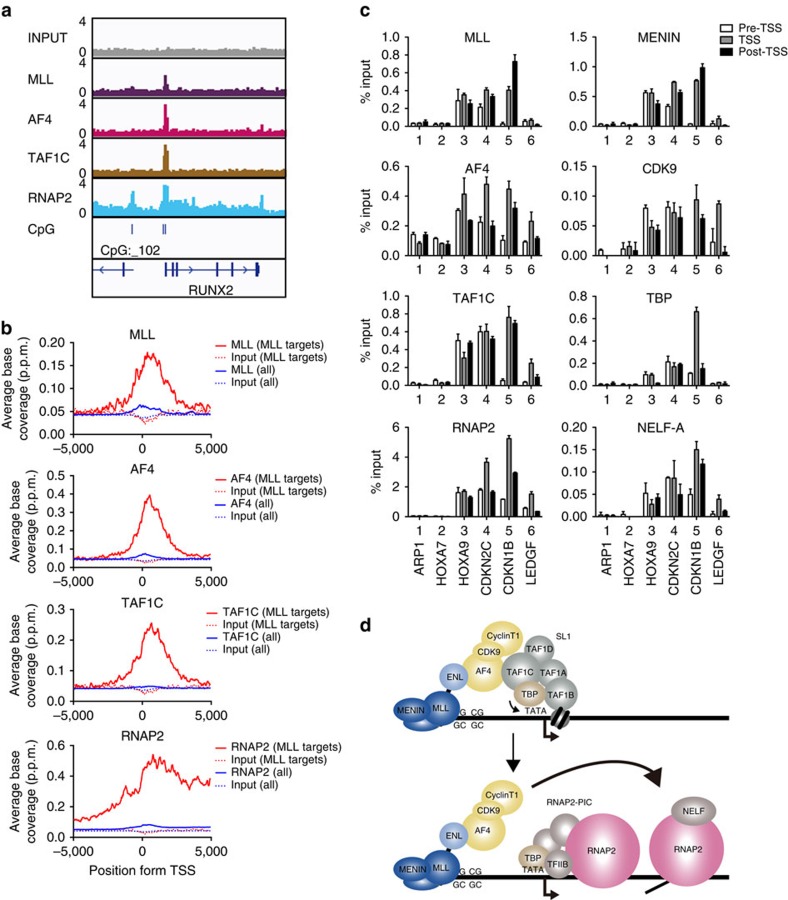
Figure 3. MLL–ENL co-localizes with TAF1C at target promoters.
(a) Localization of MLL–ENL, AF4, TAF1C and RNAP2 at the RUNX2 locus in HB1119 cells. Chromatin from HB1119 cells was used in fanChIP-seq analysis with the indicated antibodies. The ChIP signals were visualized using Integrative Genome Viewer (Broad Institute). (b) The average distribution of MLL, AF4, TAF1C and RNAP2 at the MLL-occupied loci (red line). The average distribution of each protein at all transcription start sites (TSSs; blue line) and of the input DNA (broken lines) is included for comparison. The y axis indicates the ChIP-seq tag count (p.p.m.) in 100-bp increments. (c) Localization of MLL, MENIN, AF4, CDK9, TAF1C, TBP, RNAP2 and NELF-A at various loci in HB1119 cells. The genomic localization of each protein was determined with fanChIP–qPCR. The precipitated DNA was analysed using specific probes for the pre-TSS (−1.0 to −0.5 kb from the TSS), TSS (0 to +0.5 kb from the TSS) and post-TSS (+1.0 to +1.5 kb from the TSS) regions of the indicated genes. The ChIP signals were expressed as the per cent input with error bars (s.d. of PCR triplicates). (d) A model for the cooperative transactivation of MLL target genes by SL1 and the RNAP2 transcriptional machinery. PIC, pre-initiation complex.

