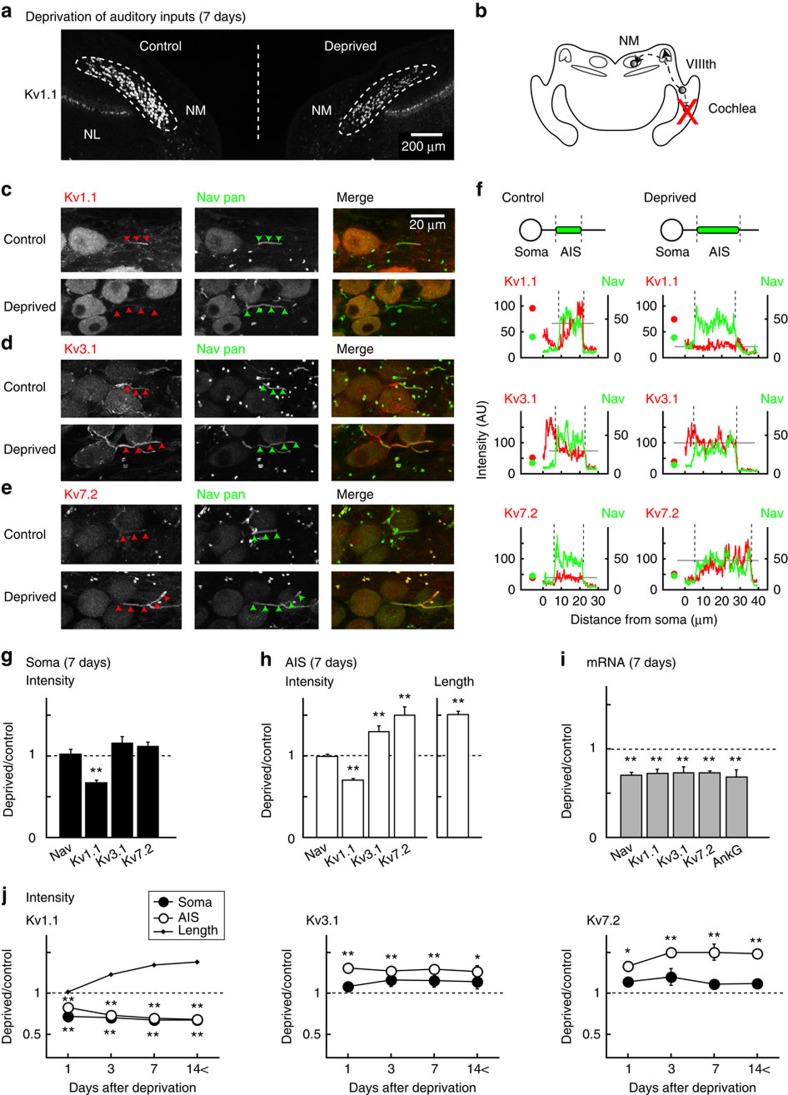
Figure 1. Expressions of Kv channels at the AIS in control and deprived neurons.
(a) Macroscopic view of brainstem auditory nuclei at 7 days after auditory deprivation. Kv1.1 immunosignals were identified in NM and its target nuclei (nucleus laminaris, NL), but the signals were more prominent in control (left) than in deprived side (right) in NM. (b) Schematic drawing of avian auditory pathway. (c–e) NM neurons stained with Kv (left, red) and Nav pan (middle, green) antibodies were merged (right). Kv1.1 (c), Kv3.1 (d) and Kv7.2 (e). Control (upper) and deprived (lower) neurons were from the same slice. (f) Intensities of immunosignals at the soma (circles) and the axon in c–e were plotted. The AIS was identified by fibrous Nav signals (arrowheads in c–e; vertical broken lines in f). Average Kv intensity at the AIS is indicated by grey horizontal lines. Dot-like Nav signals correspond to nodes of Ranvier6 (middle). (g,h) Relative signal intensities of Nav pan, Kv1.1, Kv3.1 and Kv7.2 in the soma (g) and the AIS (h) at 7 days after auditory deprivation. Relative length of the AIS (h, right). Ratios were calculated in each slice and averaged for five animals (see also Supplementary Fig. 1). Kv1.1 decreased at both the soma and the AIS, whereas Kv7.2 and Kv3.1 increased only at the AIS. (i) Relative mRNA levels at 7 days after auditory deprivation. Three sets of experiments were conducted for individual molecules (Methods). The uniform reductions of mRNA may suggest the involvement of post-transcriptional mechanisms. (j) Time course of changes in signal intensity of Kv1.1 (left), Kv3.1 (middle) and Kv7.2 (right). The time course of changes in the AIS length is plotted (left, dots). Four, four, five and six chicks were used for 1, 3, 7 and 14< days after auditory deprivation, respectively. In this and subsequent figures, * and ** indicate P<0.05 and P<0.01, respectively.

