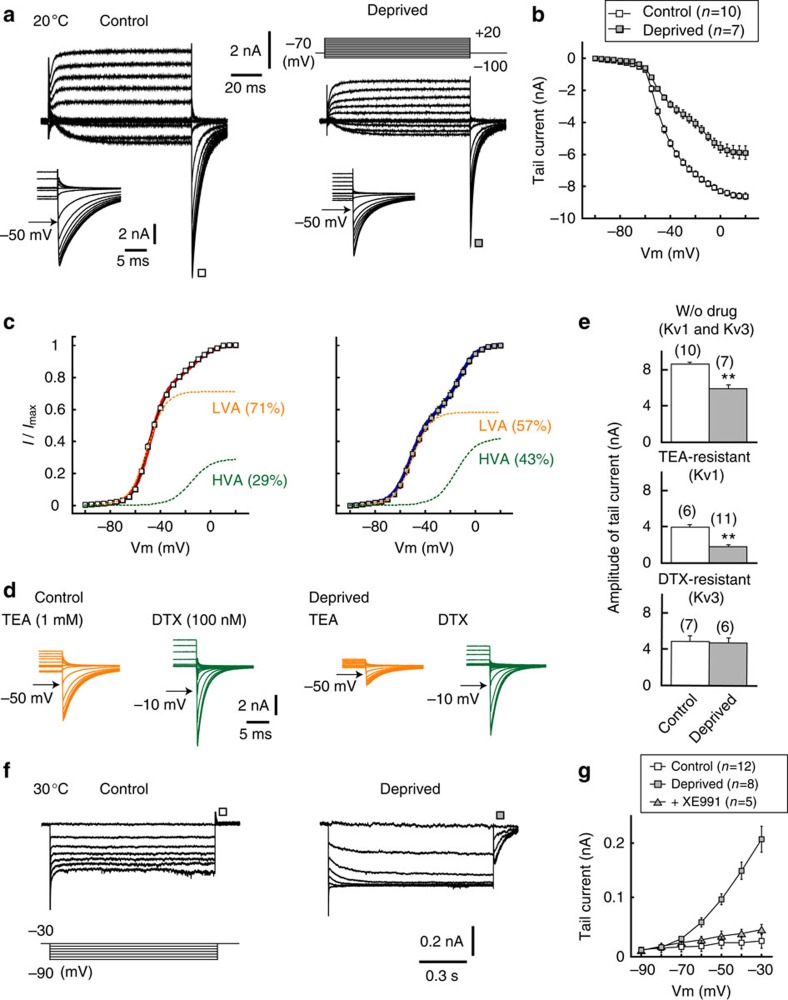
Figure 2. Auditory deprivation decreased Kv1 current and increased Kv7 current.
(a) Kv1 and Kv3 currents recorded from the soma with a Cs+-based internal solution. Recordings were conducted at 20 °C (Methods). Voltage pulses were applied at −70 mV from −100 to +20 mV (right top). Inset, tail currents. (b) Current–voltage relationships of tail currents. (c) Voltage dependence of activation curves calculated from tail currents. The curves could be fitted by a double-Boltzmann equation in both neurons (Methods). The V1/2 and slope factor of LVA (orange) were −49.1±0.7 mV and 5.9±0.3 mV, respectively, in control neurons (n=10) and −51.3±1.1 mV and 6.6±0.4 mV in deprived neurons (n=7), whereas those of the HVA (green) were −16.5±1.6 mV and 9.7±0.5 mV in control neurons (n=10) and −14.9±1.2 mV and 7.9±1.3 mV in deprived neurons (n=7). (d) Tail currents in the presence of TEA (Kv3 blocker, orange) or DTX (Kv1 blocker, green). TEA- and DTX-resistant currents reflect LVA (control: 92.3±3.2%, n=6; deprived; 85.7±2.1%, n=11; P=0.15) and HVA (control: 93.9±1.9%, n=7; deprived: 94.5±1.8%, n=6; P=0.83) components, respectively. (e) Amplitude of tail currents at −30 mV without drugs (top), with TEA (middle) or with DTX (bottom). (f) Kv7 currents recorded with a K+-based internal solution. Recordings were conducted at 30 °C (Methods). Voltages were changed between −30 and −90 mV (left bottom). (g) Current–voltage relationship of tail currents. Note that the currents were blocked with XE991 (20 μM, Kv7 blocker, grey triangles). In this and subsequent figures, numbers in parenthesis are the number of cells.

