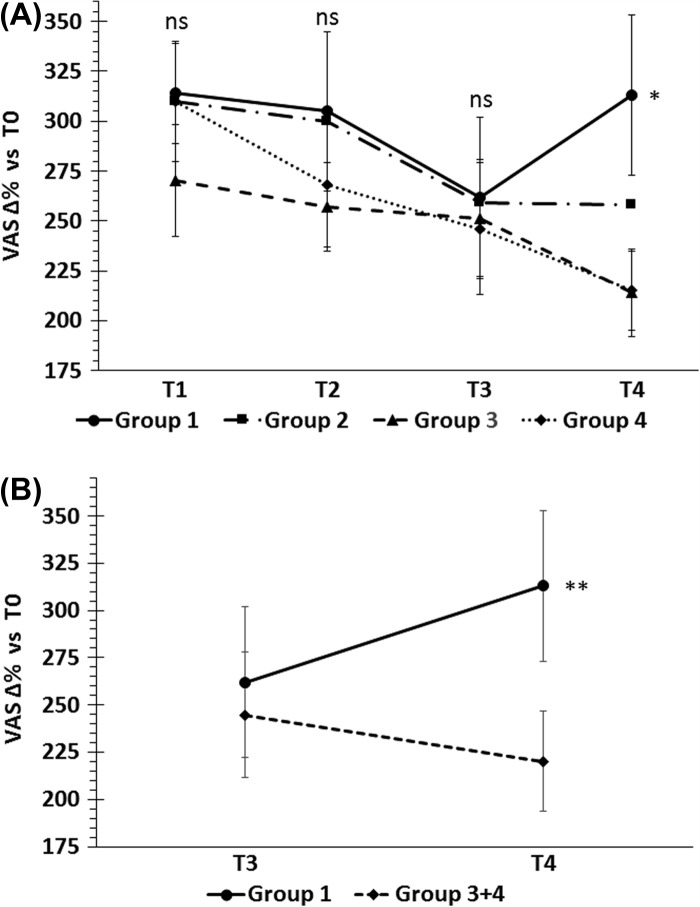
Figure 2.
Percent changes of VAS from baseline during the study. (A) No significant differences were found at T1, T2 and T3 visits, whereas at T4, when Ni-rich foods were re-introduced, the mean VAS score of group 1 (receiving the highest Ni dose) was significantly higher than the placebo group *p < 0.048, t-test. (B) Combining group 3 and group 4 raised this significance (groups 3 and 4 had similar results and group 3 dose can be considered a placebo).*p < 0.038, t-test.

