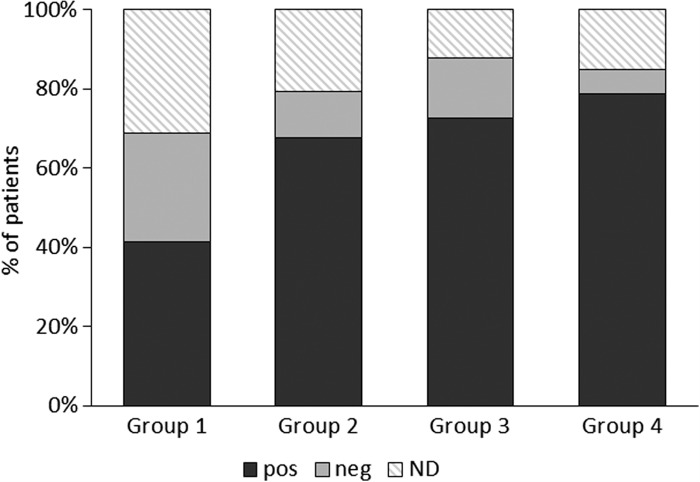
Figure 4.
Positive and negative patch tests in the four groups at the end of the study; as per inclusion criteria, all patients were patch test-positive at baseline. Values are expressed as percentage of patients evaluated in the intention to treat analysis. There were significantly more patch test-negatives in group 1 (Risk difference (95% CI): 32.9 (9.0 to 54.8); p = 0.008). Pos: positive patch test; Neg: negative patch tests; ND: not done.

