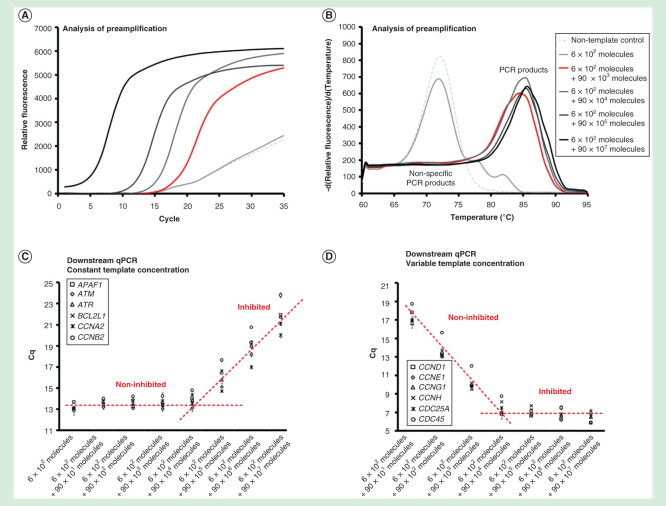
Figure 2.
Dynamic range of preamplification – the effect of total template concentration. The preamplification dynamic range with six targets at a constant initial concentration, while increasing the amounts of the other 90 targets. Analysis of preamplification: (A) preamplification response curves and corresponding (B) melting curves at six selected conditions. (C) Average Cq ± SD (n = 3) of the six assays kept at a constant initial template concentration of 100 molecules each per reaction. The linear fit is to guide the eye only. (D) Average Cq ± SD (n = 3) of six randomly selected assays from the preamplification with an initial template concentration of 0 to 107 molecules each. The linear fit is to guide the eye only.

