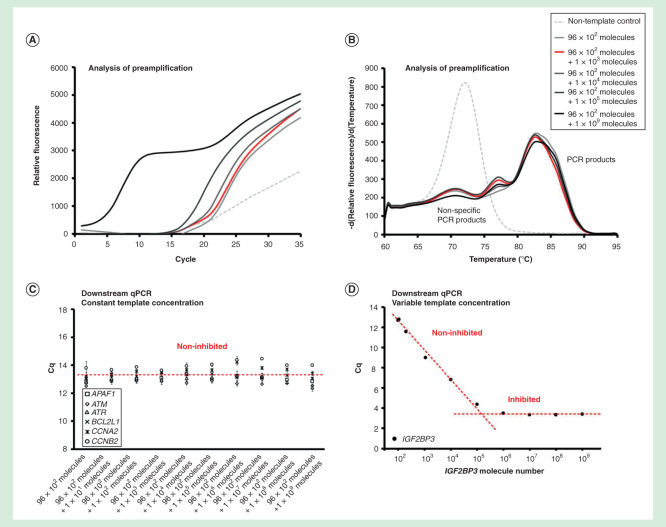
Figure 3.
Dynamic range of preamplification – the effect of one target. The preamplification dynamic range of one assay at variable initial target concentration measured in the background of 95 assays with constant target concentrations. Analysis of preamplification: (A) preamplification response curves and corresponding (B) melting curves at six selected conditions. (C) Average Cq ± SD (n = 3) of six randomly selected assays from the preamplification used at a constant initial concentration of 100 molecules each per reaction. The linear fit is to guide the eye only. (D) Average Cq ± SD (n = 3) of the single assay included in the preamplification with an initial template concentration of 102 to 109 molecules. The linear fit is to guide the eye only.

