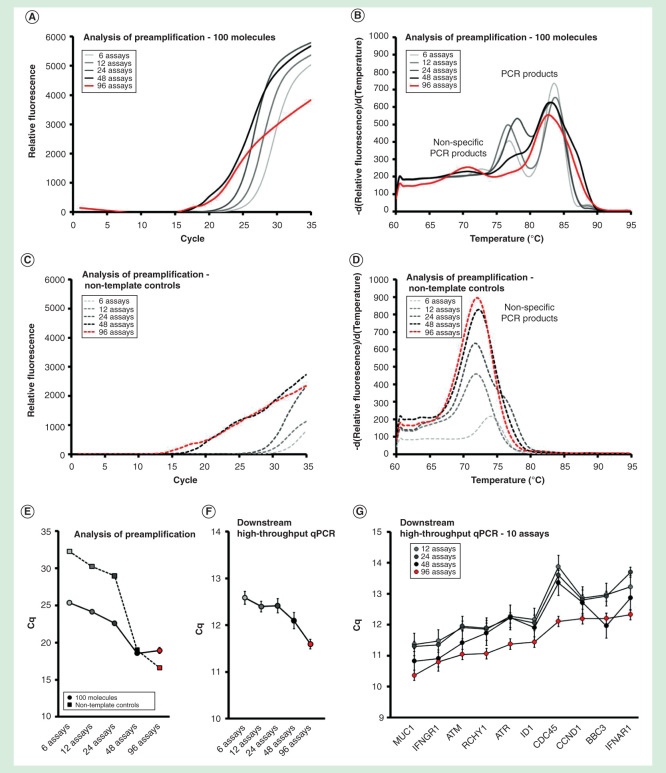
Figure 4.
Assay number dependence. The preamplification yield of specific and nonspecific PCR products formed when using 6, 12, 24, 48 and 96 pooled assays. Analysis of preamplification: preamplification response curves and corresponding melting curves for (A, B) positive samples and (C, D) negative controls. Positive samples contained 100 initial molecules of each target. (E) Cq-values (average ± SD) for positive (n = 3) and negative samples (n = 3) using different number of assays in preamplification. (F) High-throughput qPCR data of individual assays. Average Cq ± SD (n = 3) is shown. Data from all preamplified genes were used. (G) Average Cq ± SD (n = 3) of 10 assays included in the preamplification with 12, 24, 48 and 96 pooled assays.

