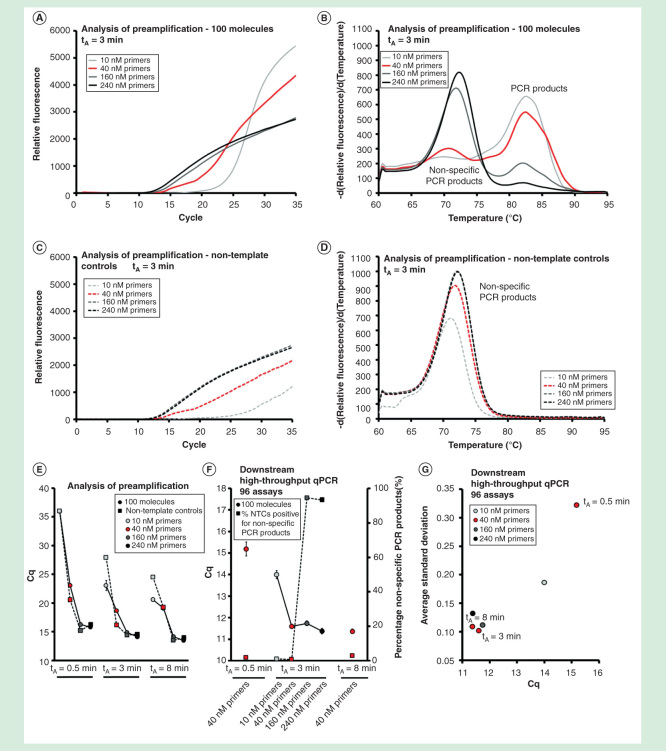
Figure 5.
The effect of primer concentration and annealing time. The preamplification yield of specific and nonspecific PCR products formed using different primer concentrations (10, 40, 160 and 240 nM, final individual primer concentrations) and annealing times (0.5, 3 and 8 min). Analysis of preamplification: preamplification response curves and corresponding melting curves for (A, B) positive samples and (C, D) negative controls. Positive samples contained 100 initial molecules of each target. (E) Average Cq ± SD for positive (n = 3) and negative samples (n = 3) using different number of assays in preamplification. (F) High-throughput qPCR data of individual assays. Average Cq ± SD (n = 3) is shown. The right y-axis indicates the percentage of negative controls positive for nonspecific PCR product formation, calculated from the 91 assays performing accurately in the preamplification (ntotal = 273, 3 negative qPCR controls per assay). (G) Average SD of Cq versus average Cq-value for all individual assays.
NTC: Non-template control.

