Figure 7.
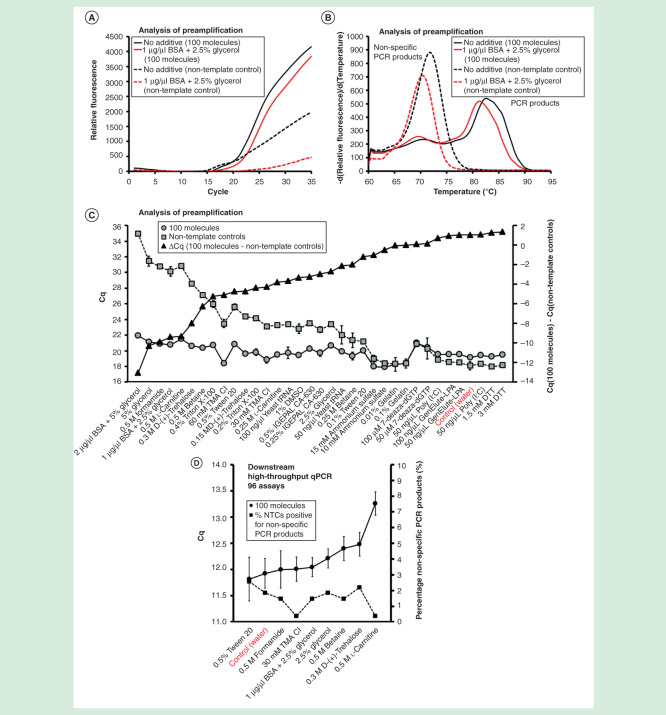
The effect of additives on preamplification specificity and efficiency. The yield and specificity of preamplification were evaluated at 35 conditions using 18 different additives. Analysis of preamplification: (A, B) preamplification response curves and corresponding melting curves for reactions in the presence of 1-µg/µl bovine serum albumin with 2.5% glycerol or water. (C) Average Cq ± SD for positive (n = 3) and negative samples (n = 3) applying different conditions for preamplification. ΔCq refers to the difference in Cq-values between positive and negative samples for each condition. Conditions are sorted according to ΔCq-value. (F) High-throughput qPCR data of individual assays for nine selected conditions. Average Cq ± SD (n = 3) is shown. The right y-axis indicates the percentage of negative controls positive for nonspecific PCR product formation, calculated from the 91 assays performing accurately in the preamplification (ntotal = 273, 3 negative qPCR controls per assay).
7-deaza-dGTP: 7-deaza-2′-deoxyguanosine 5′-triphosphate lithium salt; BSA: Bovine serum albumin; DMSO: Dimethyl sulfoxide; DTT: Dithiothreitol; LPA: GenElute-LPA; NTC: Non-template control; Poly(I:C): Polyinosinic–polycytidylic acid potassium salt; TMA Cl: Tetramethylammonium chloride.

