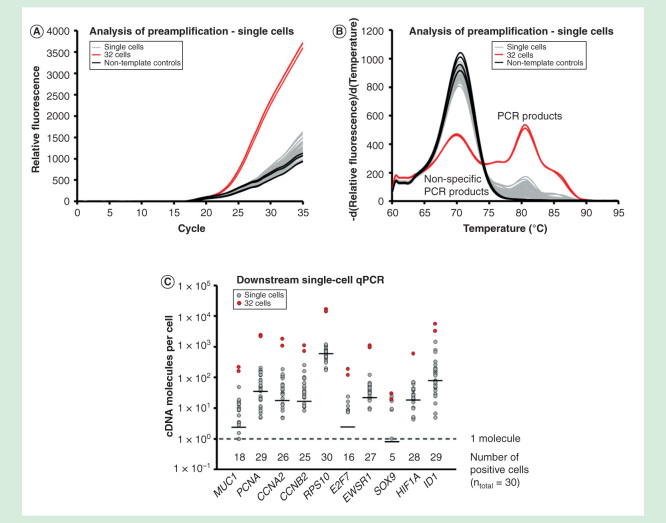
Figure 8.
Single-cell analysis. Gene expression profiling of 30 individual MCF-7 cells using targeted preamplification. Analysis of preamplification: (A) preamplification curves and corresponding (B) melting curves for reactions in the presence of 1 µg/µl bovine serum albumin and 2.5% glycerol. (C) Dot plots displaying the expression pattern of 10 selected genes.

