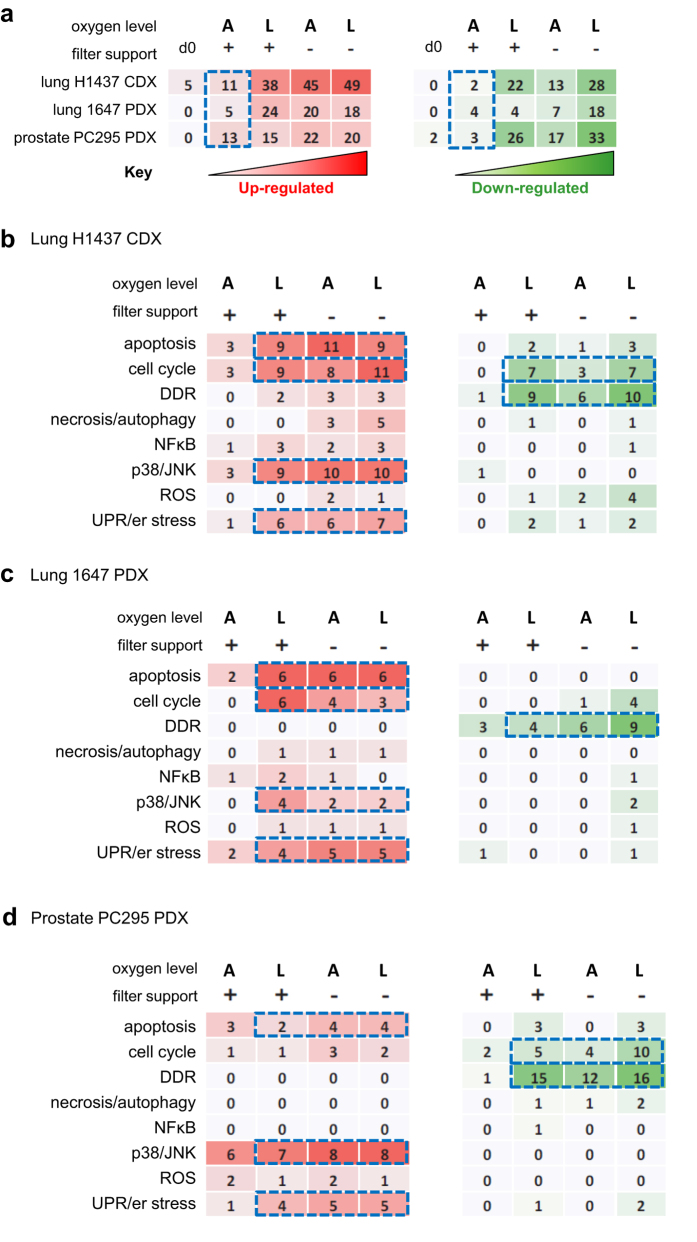
Figure 4. Pathway changes induced by tumour slice culture.
(a) Table showing the numbers of differentially expressed genes (DEGs) in prostate and lung models cultivated under different conditions. (b–d) Tables showing the numbers of DEGs under each cultivation condition and their associated functions for both of the lung tumour models and the prostate tumour model. Key: A- atmospheric oxygen, L-low oxygen, + cultivated with a filter support, –cultivated without a filter support, red = increases in expression; green = decreases in expression. Results are from 3 independent experiments.

