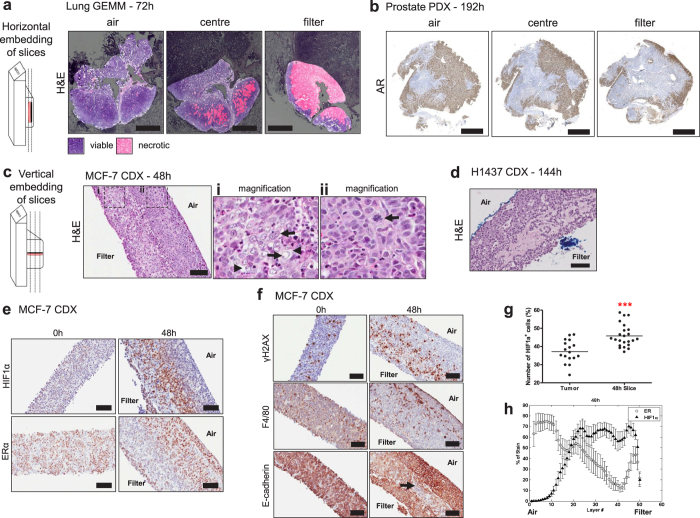
Figure 5. Loco-regional changes in IHC biomarkers in tumour slices cultivated under optimal conditions (filter support, atmospheric oxygen).
(a) Lung GEMM tumour slices, horizontally embedded, were found to contain large areas of necrosis at the filter interface of the slice. Scale bars represent 1000 μm. (b) AR staining revealed that AR positive cells were in abundance at the air interface in prostate PDX tumour slices and were greatly reduced at the filter interface. Scale bars represent 1250 μm. (c) H&E stained sections of vertically embedded MCF-7 CDX tumour tissue slices. Images show differences in tissue morphology dependent on their proximity to the air interface of the slice. (i) Arrows: areas of necrosis; arrowheads, vacuolated regions (ii) Arrow: mitotic figure. (d) H&E stained section of vertically embedded H1437 CDX tumour slice, showing similar morphology to that observed in MCF-7 tumour slices. (e) Immunohistochemical staining of HIF1α in MCF-7 tumour slices showed an accumulation of nuclear protein at the filter interface of the slice, and immunohistochemical staining of ER, which showed a reduction in staining at the filter interface. Scale bars represent 100 μm. (f) Immunohistochemical staining for γH2AX indicated an abundance of foci at the filter interface. F4/80 immunohistochemical staining showed that there was a propensity for F4/80 positive macrophages to be found closest to the air interface. Membranous E-cadherin was present at both the filter and air interfaces. Scale bars represent 100 μm. (g) The variability of HIF1α expression observed in MCF-7 CDX tumours in vivo compared with that in MCF-7 slices after 48 h (n = 17 tumours, 23 slices, ***p value < 0.0001) (h) The spatial distribution of HIF1α and ER across the thickness of the slice was quantified using a segmentation algorithm (see Methods). Each slice image was divided into 50 layers, 0 representing the layer closest to the air interface and 50 closest to the filter interface. Error bars represent standard deviation, n = 7 cultivated slices from three tumours.

