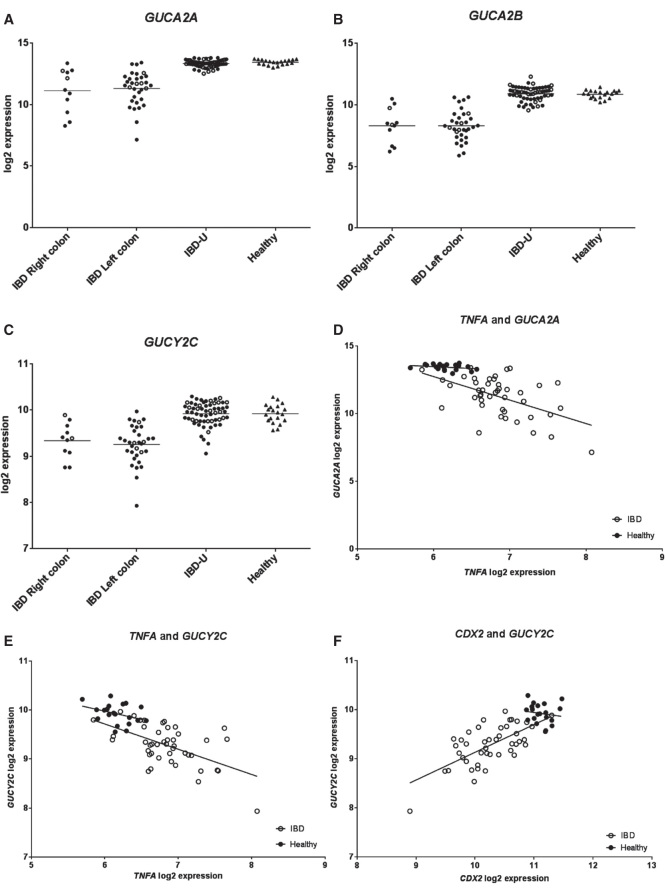
Figure 1.
Individual log2 expression for (A) GUCA2A, (B) GUCA2B and (C) GUCY2C for IBD Right colon, IBD Left colon, IBD-U and Healthy. Log2 expressions are significantly different for all genes between both IBD Right colon and Healthy and IBD Left colon and Healthy. There are no significant differences in log2 expressions neither between IBD-U and Healthy nor between IBD Right colon and IBD Left colon. Filled circles represent UC (n = 37) or UC-U (n = 42) samples and open circles represent CD (n = 7) or CD-U (n = 19) samples in A-C. (D) and (E) show individual log2 expression values for TNFA and GUCA2A and TNFA and GUCY2C, respectively. In IBD (both UC and CD) there is negative correlation between both TNFA and GUCA2A (r2 = 0.27, p = 0.0003) and TNFA and GUCY2C (r2 = 0.31, p <0.0001). (F) In IBD samples (both UC and CD) log2 expression of CDX2 positively correlates with log2 expression of GUCY2C (r2 = 0.43, p <0.0001). Figures in D-F are shown with regression lines; open circles represent individual log2 expression in IBD (both UC and CD) samples, while filled circles represent individual log2 expression in Healthy.

