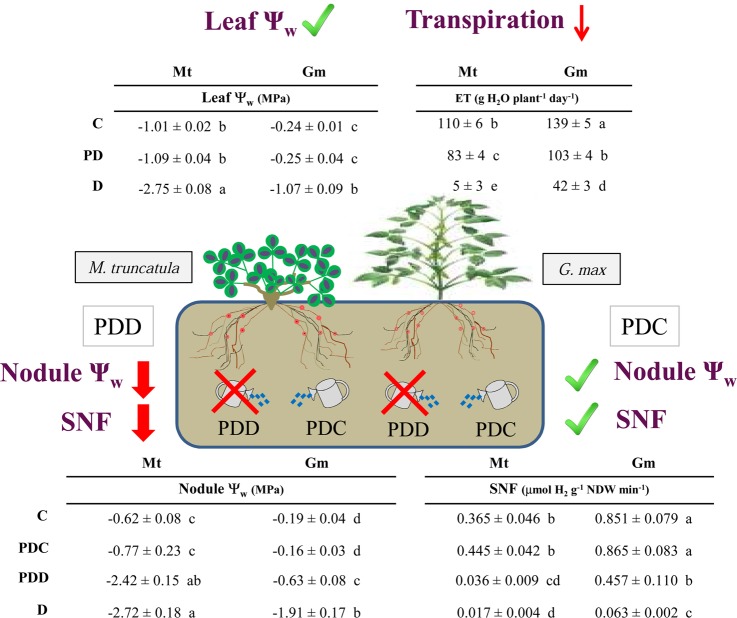
Figure 2.
Overview of the effect on leaf water potential, transpiration rate, nodule water potential, and apparent nitrogenase activity in M. truncatula and G. max plants exposed to 7 day partial drought treatment. Values represent mean ± SE (n = 3). For each parameter and species, significant differences (P ≤ 0.05) between treatments were denoted by different letters. Red arrows indicate a decreasing trend of different parameters, and the check mark symbols denote unchanged parameters.

