
Figure 1.
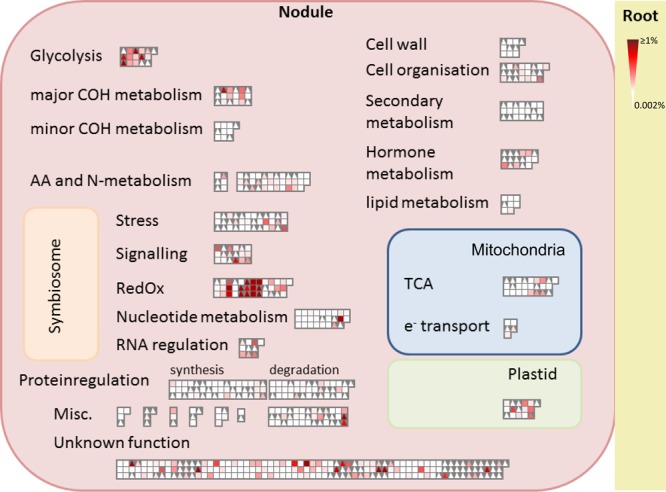
Mapman overview. Functional distribution and relative abundance of 304 M. truncatula and 341 G. max plant nodule proteins. Triangles stand for M. truncatula nodule proteins, and squares represent G. max nodule proteins. The strength of the color indicates the abundance of the protein (NSAF; normalized spectral abundance factor, n = 5).