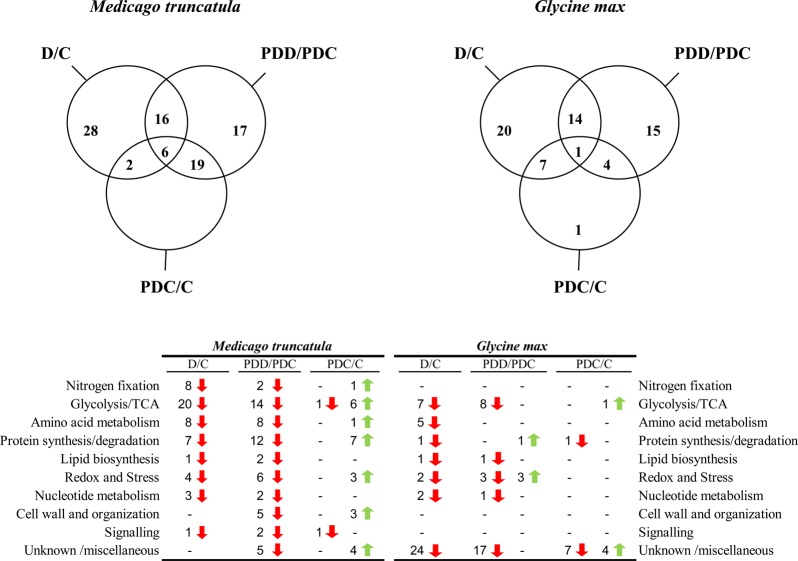
Figure 3.
Venn diagrams of M. truncatula and G. max plant nodule protein changes (n = 5, P ≤ 0.05 and fold change ≥2). A list is shown with the functional classification of the proteins and number of proteins within each comparison. Green arrows denote increases in the numerator of each comparison, and red arrows indicate decreases.

