
Table 3. Changes in G. max Nodule Plant Proteins after Drought Treatmenta.
a
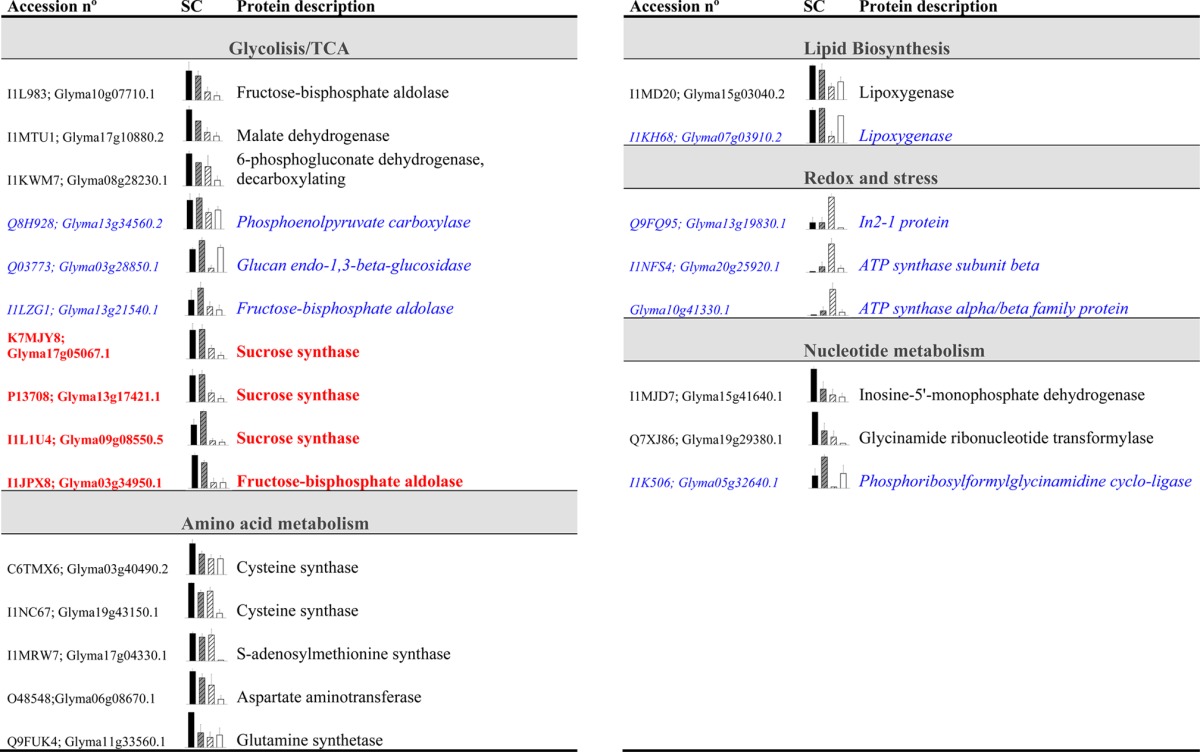
Proteins exhibiting significant changes exclusively in the total (D/C, in normal black) and partial (PDD/PDC, in italics blue) drought comparisons from Venn diagrams are listed below (n = 5, P ≤ 0.05 and fold change ≥ 2). Unknown proteins are not displayed. Proteins shared between both groups are shown in bold red. Protein accessions (UniprotKB) and gene codes are given if available. SC refers to the average of spectral count values for each treatment: C is shown in black, PDC is striped grey, PDD is striped white, and the D samples are white.