
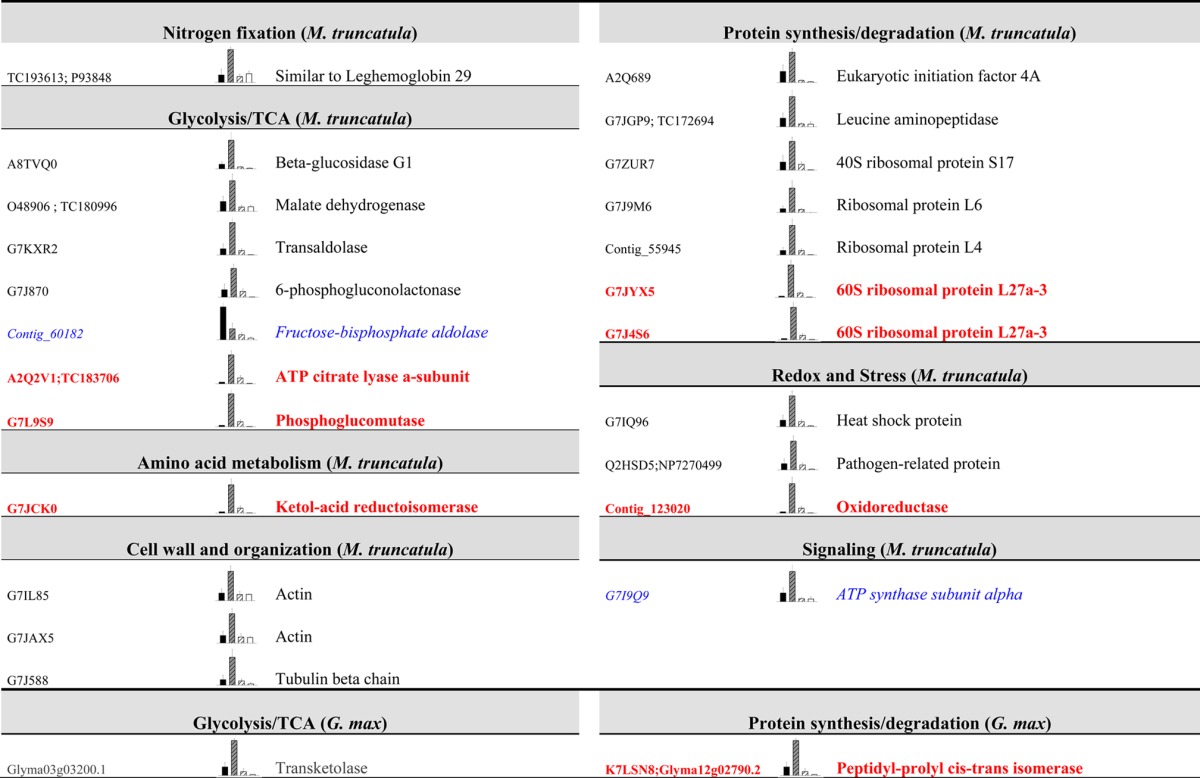
Table 4. Changes in M. truncatula (Upper Part) and G. max (Lower Part) Nodule Plant Proteins after Drought Treatmenta.
a
Proteins changed in the systemic comparison (PDC/C, in normal black; most of these are protein shared with the PDD-to-PDC comparison) from Venn diagrams are listed below (n = 5, P ≤ 0.05 and fold change ≥ 2). Proteins shared between the systemic comparison (PDC/C) and the total drought comparison (D/C) are shown in blue italics, and proteins shared among the three comparisons are shown in bold red. Unknown proteins are not displayed. C is shown in black, PDC is striped grey, PDD is striped white and the D samples are white.