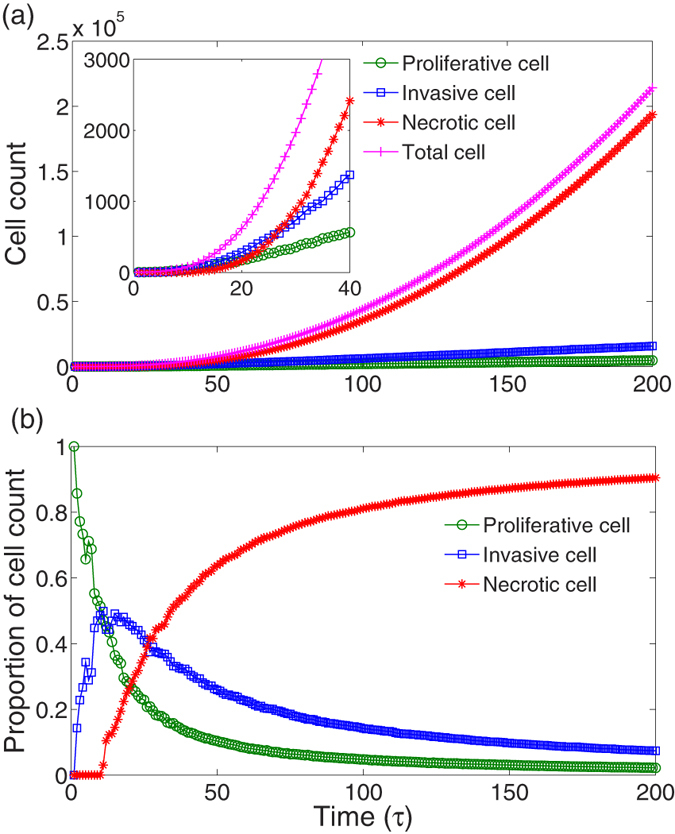
Figure 2. The population of tumor cells over time.

(a) The total number of tumor cells and the cell counts of different phenotypes increase over time. The inset displays the time evolution of cell numbers in the early stage of tumor growth. With the emergence of necrotic cell, the exponential growth of proliferative and invasive cells become linear at approximately 30 τ. (b) The time evolution of proportions of different phenotypic cells. Finally, almost all cells are necrotic. Here, the parameters are αpp = βii = 0.1, and the others are the same as those in Table S1.
