
Figure 5. The contour plot of average radial growth velocities 〈v〉 over 10 trials with with respect to the interactions between two invasive cells βii and between two proliferative cells αpp.
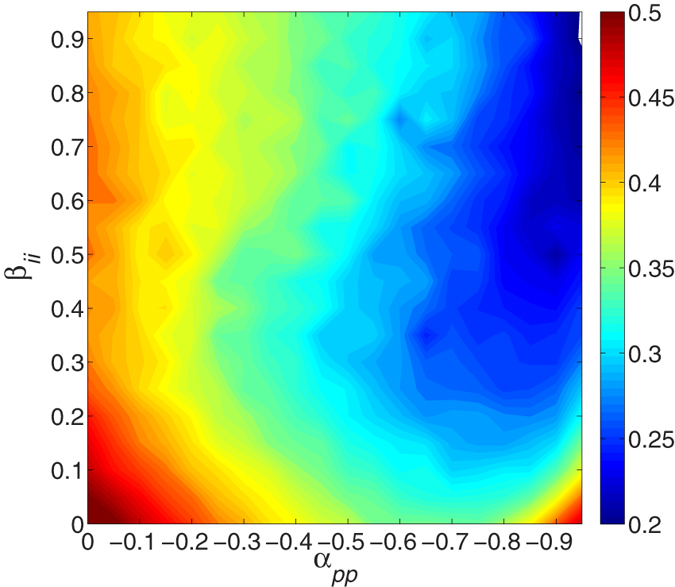
If αpp is fixed in the range of nearly αpp < 0.9, v decreases with increasing βii but increases again with further increases, and vice visa for βii < 0.3. Other parameters are in Table S1. See text for additional detail.