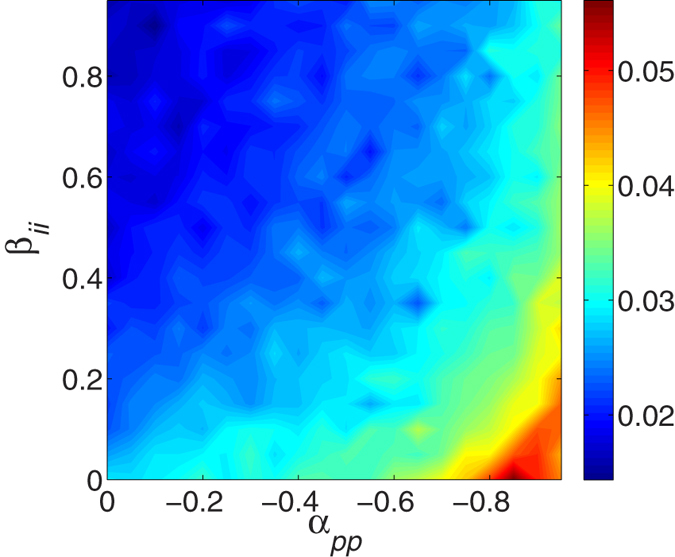
Figure 8. The contour plot of average velocities 〈vr〉 over 10 trials with with respect to the interactions between two invasive cells βii and between two proliferative cells αpp.

Clearly, larger inhibition between two proliferative cells and smaller enhancement between two invasive cells lead to the slower increase of global surface roughness. Other parameters are in Table S1. See text for additional detail.
