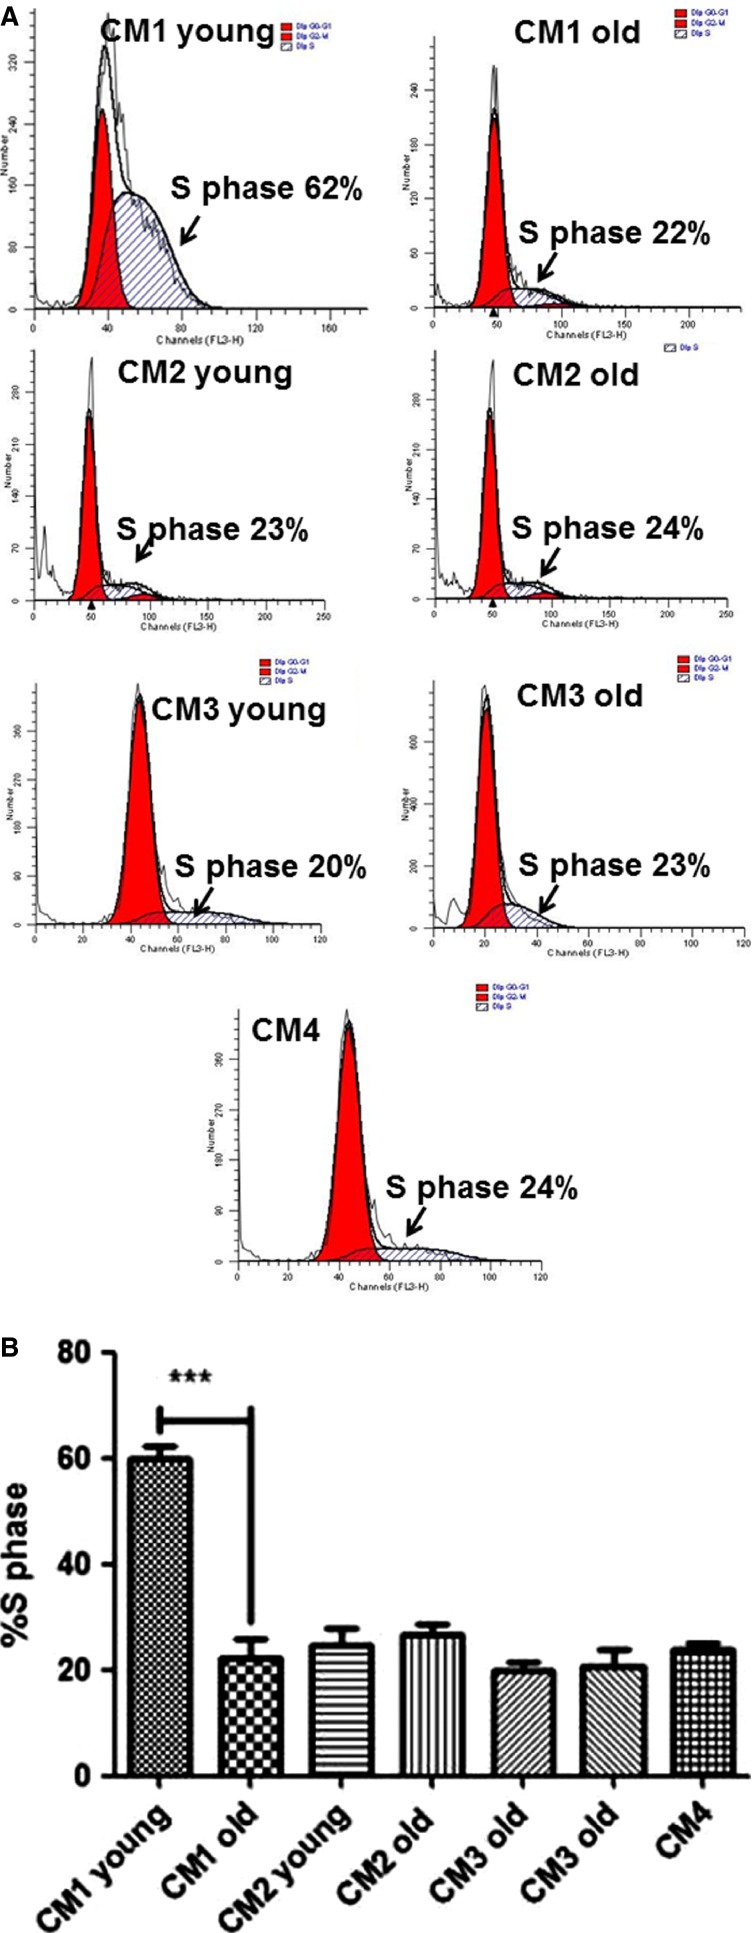
Figure 2.
(A) Images of S-phase flow cytometry cell cycle analysis for each condition. %S phases of myoblasts treated in conditioned media CM1–4 after 4 days. Young CM1 treated myoblast showed higher %S phase compared to Old CM1 treated myoblasts, ***P < 0.0001 (B). All controls of our study were not significantly different, P > 0.05. The bar graph represents four independent experiments.

