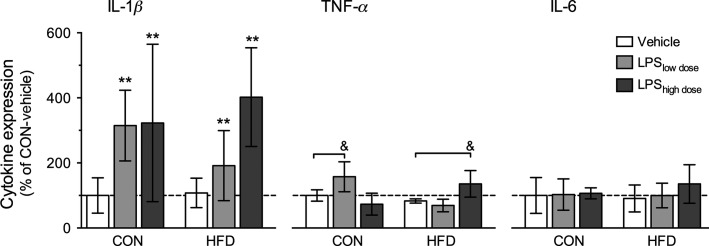
Figure 5.
Proinflammatory cytokine expression in hypothalamus. IL-1β (two-way ANOVA, HFD: F1,22 = 0.09, P = 0.77, LPS: F2,22 = 6.00, P = 0.008), IL-6 (two-way ANOVA, HFD: F1,22 = 0.08, P = 0.79; LPS: F2,22 = 0.54, P = 0.59), TNF-α (two-way ANOVA, interaction between LPS × HFD: F2,22 = 14.57, P = 0.0001; Tukey test, CON-LPSlow dose versus CON-vehicle and HFD-LPShigh dose versus HFD-vehicle, P < 0.05). Data are presented as mean percentage of CON-vehicle ± SEM (n = 4–5 rats per group). * indicates significant effect of LPS, with **P < 0.01 (two-way ANOVA), & indicates significant difference from control, with &P < 0.05 (Tukey’s test).

