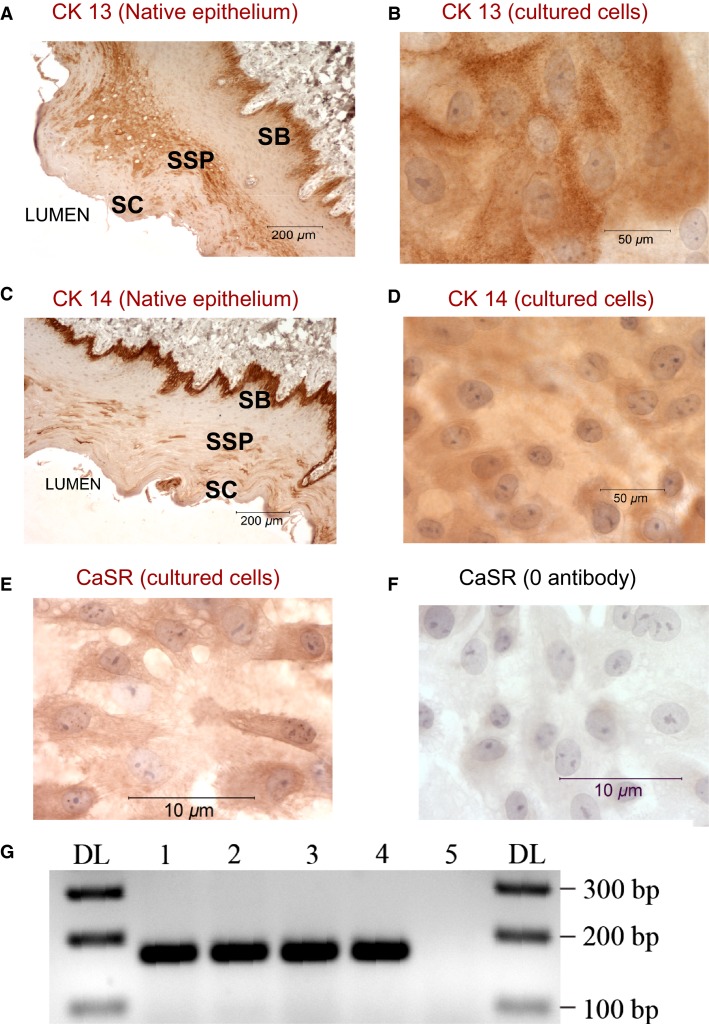
Figure 3.
Characterization of the cells in culture. CK13 and CK 14 staining of esophageal section (A and C respectively) and of cultured squamous cells (B and D). Brown deposits indicate positive staining in basal and suprabasal layers of the epithelium. Cells in culture also stained positive for CK13 and Ck14 indicating their similarity to epithelial cells of the esophagus. Representative data from 3 different experiments. SB (stratum basalis), SSP (stratum spinosum), SC (stratum corneum). E) CaSR expression in cultured esophageal cells by IHC. (E), shows immunostaining of SSE cells grown in control 1.2 mmol/L Ca+2. SSE cells stained positive for CaSR (brown deposits). (F), negative control, the primary antibody to CaSR was omitted from immunostaining procedure. (G), RT-PCR amplification of CaSR products performed on extracted total RNA: lane 1, cultured cells from esophageal submucosal glands (SMG); lane 2, cultured cells from squamous epithelium, lane 3, native squamous esophageal tissue; lane 4, esophageal submucosal glands (SMG). Lane 5 is a negative control where all the reactants (as in lane 3) are present but Taq polymerase was omitted from the reaction. The first and last lanes are DNA ladder. A prominent band at the expected size of 170 bp confirmed the expression of CaSR in squamous esophageal tissue, SMG, and in cultures derived from these tissues. The sequences of the products are shown in Table2. Representative data are from four different experiments.

