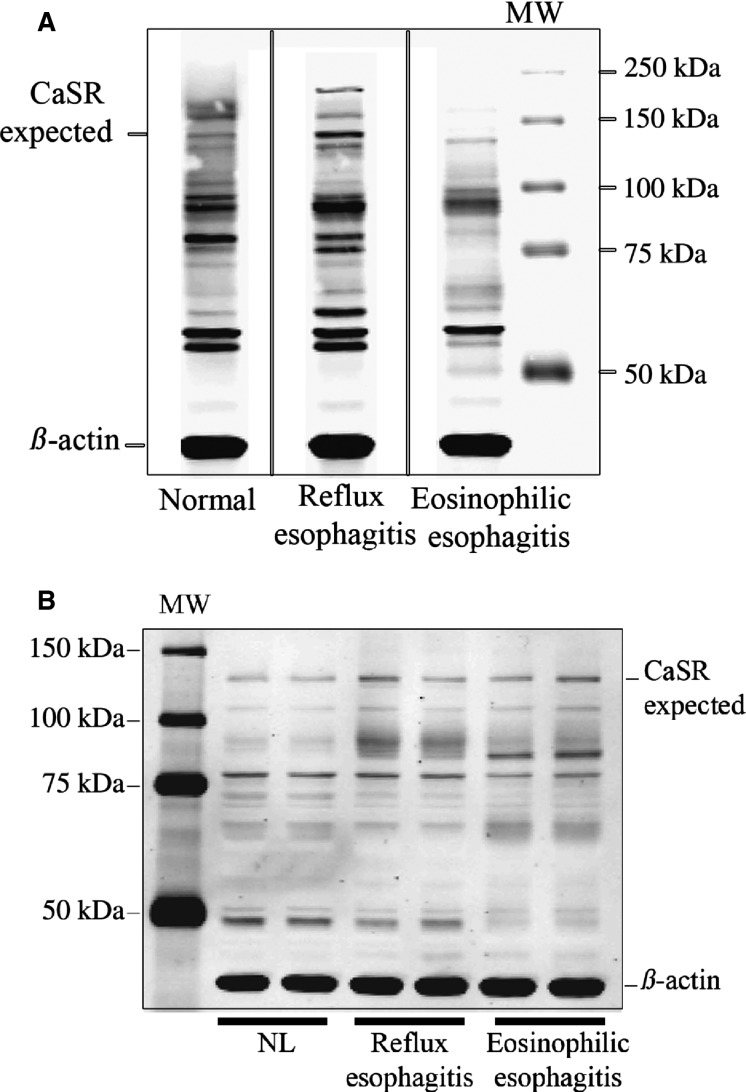
Figure 7.
Western analysis of lysates from human biopsies. (A) Immunoblot showing the distribution of CaSR in biopsies from normal (NL) esophagus, reflux esophagitis (RE), and eosinophilic esophagitis (EoE) tissues. The blot was stained with a mouse antibody (Sigma-Aldrich) raised against human CaSR (amino acid peptide sequence 15–29 at the extracellular N-terminus of human CaSR). A CaSR band was evident at the expected MW of 130 kD and at 160 kD (the glycosylated form). However, similar to the blot from pig squamous cells other reactive bands were also present at ∼90, 80, and 60 kD possibly resulting from proteolytic degradation of the receptor. Vertical solid lines indicate noncontiguous lanes of the same gel. B: Immunoblot from a different set of biopsies; normal, RE and EoE patients. The blot was stained this time with a polyclonal antibody to CaSR raised against the C-terminus of human CaSR (Millipore). The blot shows a band at the expected MW of 130 kD, but it also shows clusters of bands at smaller MWs.

