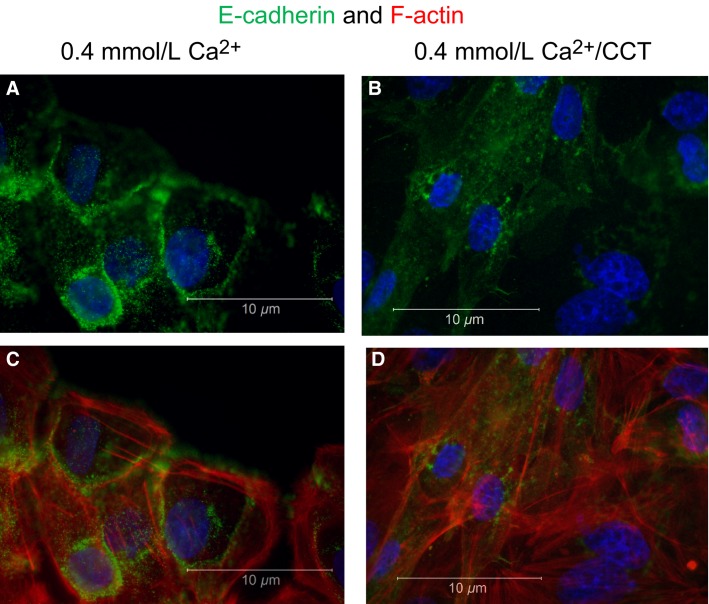
Figure 8.
Effect of cinacalcet on E-cadherin distribution. The figure shows staining for E-cadherin (green fluorescence), DAPI (blue) and F-actin (phalloidin, red) in SSE cells. (A) and (C) show nontreated cells grown in 0.4 mmol/L Ca+2. In (B) and (D) the cells were treated for 48 h with 2.5 μmol/L CCT/0.4 mmol/L Ca+2. Cells treated with CCT lost their polygonal shape, E-cadherin redistributed from the cell membrane to the cytoplasm and F-actin elongations were prominent. Representative figures are from three different experiments.

