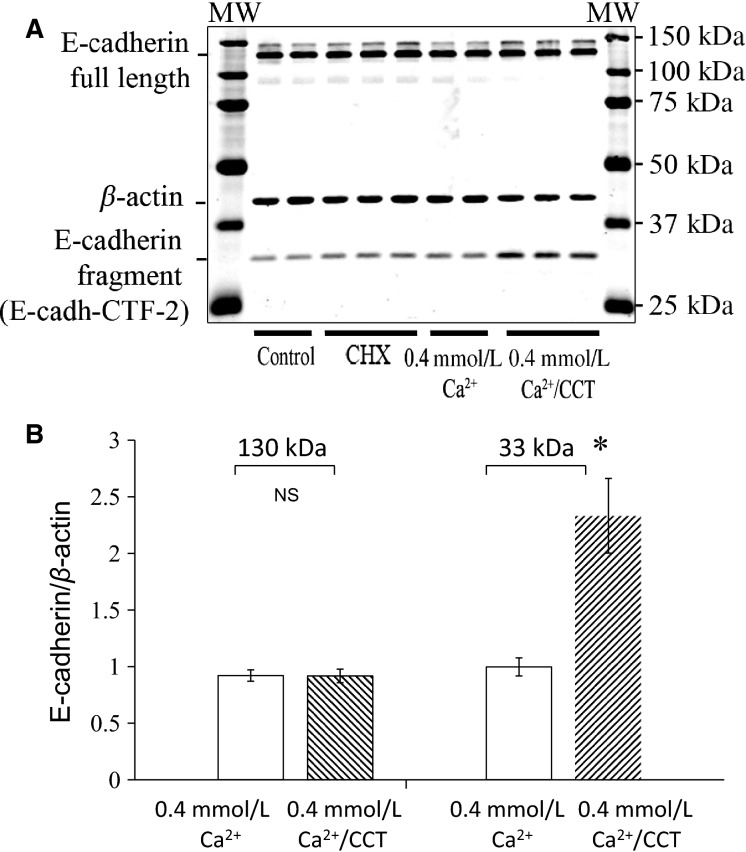
Figure 10.
Effect of CaSR modulation on E-cadherin expression. (A), immunoblot analysis of lysates from control cells, cells treated with CHX, cells maintained in 0.4 mmol/L Ca+2 and cells treated with 2.5 μmol/L CCT/0.4 mmol/L Ca+2 for 48 h. The blot was stained for E-cadherin. Expression of E-cadherin fragment at 33 kD (E-cadh-CFT2) was significantly increased in CCT-treated cells. (B) is a bar graph showing that E-cadherin expression at the expected MW of 130 kD was not statistically different among the treatment groups. There was relative increase in expression of E-cadh-CFT2 in cells treated with CCT/0.4 mmol/L Ca+2 (2.3 folds, P < 0.01) as compared to nontreated cells. Data are from four different experiments. For each experiment, data from duplicates or triplicates were averaged for each sample to yield one data point (N = 4, *P < 0.02).

