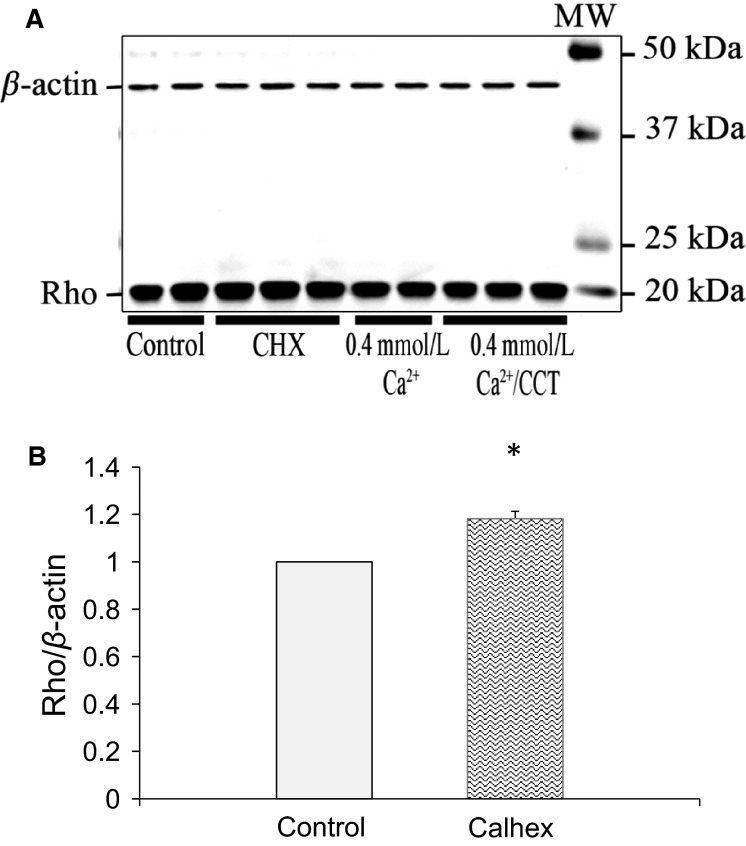
Figure 13.
Rho expression in response to allosteric modulation of CaSR. (A), immunoblot analysis of lysates from control cells, cells treated with CHX, nontreated cells maintained in 0.4 mmol/L Ca+2 and cells treated with CCT/0.4 mmol/L Ca+2 for 48 h. The blot was stained for Rho. Rho expression at the expected MW of 20 kD was higher (by 18%) in cells treated with CHX. (B) is a bar graph showing relative increase in expression of Rho in cells treated with CHX as compared to nontreated control cells. Data are from three different experiments. For each experiment, data from duplicates or triplicates were averaged for each sample to yield one data point. (N = 3, *P < 0.03).

