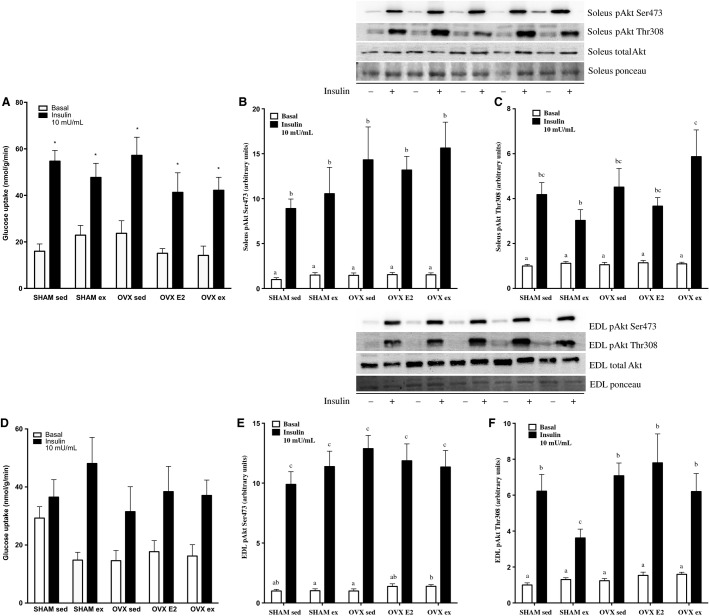
Figure 2.
Basal and maximally insulin-stimulated glucose uptake in soleus and EDL (A, D), protein content of insulin signaling markers before (basal) and after (+insulin) 7.5 U/kg b.w injection in soleus p-Akt Ser 473 and p-Akt Thr308 (B, C) and EDL p-Akt Ser473 and p-Akt Thr308 (E, F). Data are expressed as mean ± standard error, n = 10 per group. Groups which share a letter are not significantly different. In (A), bars with an asterisk denote a significant insulin effect relative to the basal control within each group. Statistical significance is accepted at P < 0.05. In (D), P = 0.07 for the effect of insulin. In panel B, within +insulin group differences were as follows: OVX ex versus SHAM sed P = 0.06, OVX ex versus SHAM ex P = 0.08, OVX E2 versus SHAM sed P = 0.07, OVX ex versus SHAM ex P = 0.09; in panel C: OVX ex versus OVX E2 P = 0.09, SHAM ex versus SHAM sed P = 0.09 as assessed by two-way ANOVA.

