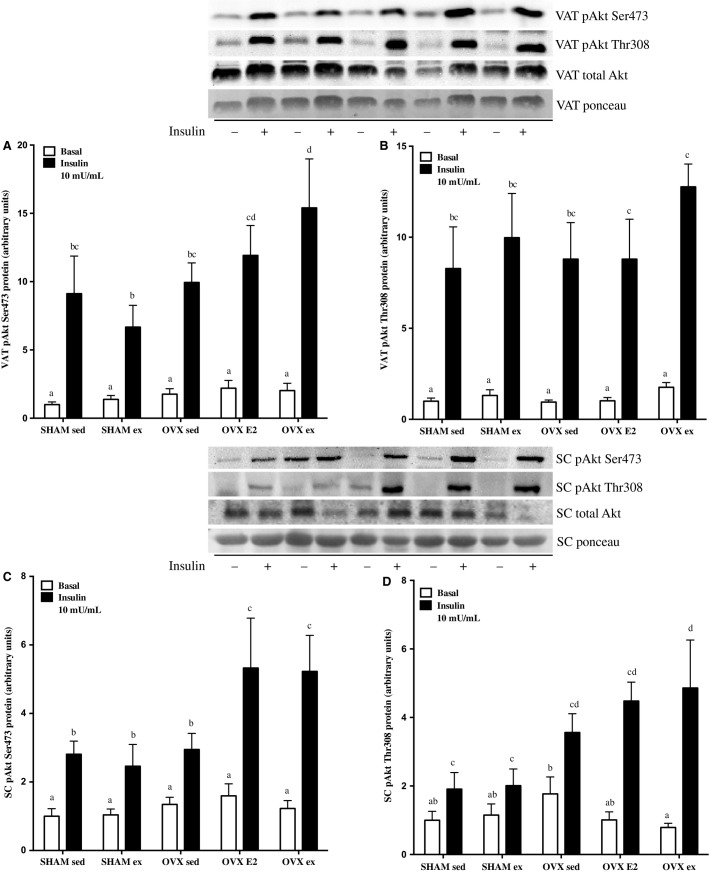
Figure 4.
Protein content of insulin signaling markers before (basal) and after 7.5 U/kg b.w injection of insulin in visceral adipose tissue (VAT) p-Akt Ser473 and Thr308 (A, B) and subcutaneous adipose tissue (SC) p-Akt Ser473 and Thr308 (C, D). Data are expressed as mean ± standard error, n = 10 per group. Groups which share a letter are not significantly different. Statistical significance is accepted at P < 0.05. In panel B, within +insulin group differences were as follows: OVX ex versus OVX sed P = 0.08, OVX ex versus SHAM sed P = 0.053 as assessed by two-way ANOVA.

